RockWorks | ModOps | Grid | Statistics | Residuals
Use this program to compute the difference between observed Z values (listed in the datasheet) and computed Z values in an existing grid model. Both the model's Z values at the listed X,Y points and the residuals will be listed in columns in the datasheet.
! This program requires that the source data, from which the grid model was computed, be displayed in the main RockWorks Datasheet.
See also the Scattergram program for a scatter diagram that will display observed data values versus computed node values.
Menu Options
Step-by-Step Summary
- Data Columns
- Input: Use these prompts to specify the columns in the datasheet that list the original data from which the grid model being analyzed was created.
- X (Easting), Y (Northing): Select the columns that contain the X and Y location coordinates for the source data.
- Z (Elevation): Select the data sheet column that contains the original Z values that are modeled in the grid model, below.
- Output:
- Z (Predicted): Click here to specify the name of the column in the current datasheet into which the grid model's values at the listed XY locations will be listed. Any existing data in this column will be overwritten.
See View | Columns for instructions on entering column titles.
- Residuals: Click here to specify the name of the column into which the computed residuals are to be listed.
- Grid File: Click this tab to browse for the name of the existing grid model (.RwGrd file), created from the data now shown in the main data sheet, whose node values are to be compared with the source Z values.
- Access the RockWorks Datasheet program tab.
- Open the XYZ data from which the grid model was created. This is necessary because the program needs to know the original observed values against which the grid model values will be compared.
- If the grid model was created in the using a ModOps program, the original data was probably stored as an .RwDat file; use the File | Open option to access that file, or open it through the Project Manager.
- If the grid model was created in the Borehole Manager, you can transfer the original data to the RockWorks Datasheet for use with this program, using several methods:
- For elevations at the top of the well, use the Borehole Manager's File | Locations -> Datasheet option to transfer Location tab data to the Datasheet.
- For stratigraphic elevations, use the Borehole Manager's File | Export | Stratigraphy program to save the data to an .RwDat file.
- For water level data, use the Borehole Manager's File | Export | Aquifer program to save the aquifer data to an .RwDat file.
- Select the ModOps | Grid | Statistics | Residuals menu option.
- Enter the requested menu settings, described above.
- Click the Proceed button to continue.
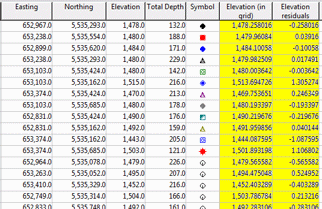
The program will read the original data values from the main data sheet. It will determine the calculated grid model Z-values for each control point location and compute the difference of observed minus grid values. The grid model values and residual values will be listed in the selected datasheet columns.
TIP: Use the Utilities | Statistics | Histogram program to display the range of residual values. This gives a nice display of the accuracy of the model's nodes.
 Back to Grid Menu Summary

RockWare home page