RockWorks | ModOps | Grid | Create | XYZ -> Google Earth Cell Map
This program reads XYZ values from the datasheet, generates a "cell-model" grid file (.RwCMod file) and displays this as color-coded cells in Google Earth. The cells can represent the average, cumulative, distance, frequency, minimum, maximum, or distance-weighted values for the samples. The cells are scaled by color and/or height. Cell descriptions can be included. The cell map grid model can be saved for later use.
Feature Level: RockWorks Basic and higher
Menu Options
Step-by-Step Instructions
- Data Columns
Use these prompts to tell RockWorks which columns in the input datasheet contain the required data.
See a sample data layout below.
- X: Column that contains the X coordinates for the measurement sites.
These can be Eastings in meters or feet, decimal longitudes, etc. See Defining your Datasheet Coordinates for more information.
- Y: Column that contains the Y coordinates for the sites.
- Z: Column that contains the measured values to be modeled.
- Cell Map
- File: Use these settings to determine whether a new or existing cell-model grid file (.CMod file) is to be used.
- Create New Cell Model: Choose this option if the program is to create a new model for this cell map.
- New Cell Model Name: Click to the right to type in a name for this cell model (.RwCMod file).
- Use Existing Cell Model: Choose this option if you've already created a cell model for this data and don't need to re-create it.
- Existing Cell Model Name: Click to the right to browse for the name of the cell model (.RwCMod) you wish to use for this cell map.
- Z Filter: Check this box if you want to exclude any of the samples in the datasheet, based on the Z-Value recorded there. Click on the tab to set the filter values.
- Minimum Z-Value: Enter here the minimum value for the data listed in the Z-Column (which you selected under Input Columns to the left) to be included in the map calculations.
Example: Let's say you are mapping sediment data, and do not wish to include any values below "2.5", you would enter that value here.
- Maximum Z-Value: Enter the maximum value in the Z-Column to be included in the map calculations.
- Model Dimensions: Use these settings to determine the extent of the cell model and map.
- Automatic (Based on Data Range): Choose this if you simply want the program to create the cell map across the entire data range. This is the easiest option.
- Entire Sphere: Choose this option if your data spans the entire globe, and you want the cell map to encompass this range.
- Manual: Choose this option to define the extents manually.
- Longitude:
- Minimum (Western border): Enter the longitude for the western edge of the cell map, in decimal degrees. Western longitudes must be entered as negative values.
- Maximum (Eastern border): Enter the longitude for the eastern edge of the map, in decimal degrees.
- Latitude:
- Minimum (Southern border): Enter the latitude for the southern edge of the cell map, in decimal degrees. Southern latitudes must be entered as negative values.
- Maximum: (Northern border): Enter the latitude for the northern edge of the map, in decimal degrees.
- Ignore Data Outside This Region: Check this option if any data points outside this area are to be ignored.
- Cell Dimensions: These define the size of the individual cells (and, hence, the resolution of the cell map).
! Note that if you are mapping data across the entire globe and make your cells quite small, the modeling process will be very slow.
- Decimal Degrees: Choose this option to set the cell size in terms of decimal degrees.
- Width (East/West): Enter here the width for each cell, in decimal degrees. For example, if you enter "0.1", then the cell width will be 1/10 of one degree of longitude (10 cells per degree). If you are mapping the entire globe, try "2.0" for starters.
- Height (North/South): Enter here the height for the cells, as above in decimal degrees. The cells don't have to have the same width and height dimensions.
- Meters: Choose this option to define the cell size in meters.
- Width (East/West): Enter here the width for each cell, in meters. For example, if you enter "100000", then each map cell width will be 100 km wide.
! The correct value to enter here depends on the Model Dimensions, above, and the resolution of your data. If you're mapping data across the globe, don't set this to "1000" - you'll grow old before the program divides the planet into 1 km cells.
- Height (North/South): Enter here the height for each cell, in meters. The cells don't have to have the same width and height dimensions.
- Arbitrary (Number of Cells): Choose this option to define the number of cells in the map, rather than cell size as above.
- X (East/West) Nodes: Enter the number of cells you wish to create from west-to-east across your map area.
- Y (North/South) Nodes: Enter the number of cells you want to create from south-to-north across your map area.
- Type of Model: Click this tab to choose the type of cell map you wish to create.
- Average: Choose this option for the cells to represent the average Z value for points within the cells.
- Cumulative: Choose this option for the cells to represent the sum of all Z values for points within the cells.
- Distance: Choose this option for the cells to represent the distance from the cell nodes (midpoints) to the closest data point.
- Multiply by -1: Check this box if you want the distances to be multiplied by -1 so that small (close) values will be greater than high (far) values, and will show up in red on an automatic color scheme.
- Frequency: Choose this option for the cells to represent the number of points within them.
- Maximum: Choose this option for the cells to represent the highest Z value for points within the cells.
- Minimum: Choose this option for the cells to represent the lowest Z value for points within the cells.
- Weighted: Choose this option for the cells to represent the distance-weighted value based on neighboring points.
- Cell Map
- Opacity: Set the opacity for the cells, with 0 = fully transparent and 100 = fully opaque.
- Include Cell Descriptions: Check this box if you want the cell values to be recorded in the KMZ file for your reference.
- Colors: Choose the coloration method for the cells.
- Automatic: This is the easiest method - cells with the lowest values will be plotted in pink, cells with the highest values will be plotted in red, with intermediate cells scaled in between on a cold-to-hot color scale.
- Defined by Table: Choose this option if you have defined a "Color Fill Table" in the project database which defines value ranges and colors.
- Table Name: Click on the drop-down list to select the name of the Color Fill Table to use in colorizing the cell map.
- Extrude Cells: Insert a check here to have the cells extruded above ground, with the height determined by the cell values. Click on this tab to set the extrusion options.
- Automatic: Choose this option to have the program scale the heights of the cells automatically.
- Minimum Elevation (Meters): Enter the minimum elevation for the cells, in meters.
Note that if your cells are relatively large, you'll need to set the minimum to something > 0 so that they don't become hidden by the curvature of the earth. You'll also need to consider the elevation of the topography in the area covered by your map.
- Maximum Elevation (Meters): Enter here the highest elevation for the cells with the maximum values. Intermediate values will be scaled proportionally between the min and max.
- Defined by Table: Choose this option if you have defined a "Scale Table" in the project database, which defines value ranges and "Size" which, in this context, will represent extrusion elevation in meters.
- Table Name: Click on the drop-down list to select the name of the Scale Table to use in defining the cell heights.
- Distance Filter: Insert a check here to exclude samples from the cell map calculations which are beyond a specified distance from listed points.
- Cutoff Distance (Meters): Click to the right to enter the cutoff distance in meters.
- Group Name: Type in the name to assign to map in Google Earth.
- Output Options: Click on this tab to define the output file and display settings.
-
- Output File Name
-
- Automatic: Click this option to have RockWorks assign a name to the KMZ file which will be generated for display in Google Earth.
- Manual: Click this option to type in your own file name. The extension is ".KMZ".
- Display output within Google Earth: Check this box if you want to display the output at this time in Google Earth.
-
- Use Custom View: If unchecked, the starting viewpoint for the map will be determined automatically. If checked you can set a custom view.
-
- Longitude, Latitude: Type in the longitude and latitude coordinates where the viewpoint will be.
- Heading: Type in the 0 to 360 degree bearing from the viewpoint to the map.
- Tilt: Type in the angle downward from the viewpoint to the map.
- Range: Enter the distance in meters from the viewpoint to the map.
- Access the RockWorks Datasheet program tab.
- Create a new datasheet and enter or import your location coordinates and measurements into the datasheet.
Or, open one of the sample files and replace that data with your own. See Data Layout for datasheet examples.
! Click the Example button at the top of the window to load a sample file that is installed with the program.
This example illustrates the sample file "Grid_Create_Earth_CellMap_Oceans.rwdat"
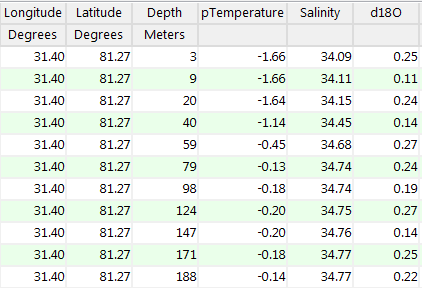
Longitude and latitude coordinates must be in decimal format. If you're using another coordinate system, be sure you've specified the Units and the Projection Settings as appropriate.
- Select the ModOps | Grid | Create | XYZ - Google Earth Cell Map menu option.
- Enter the menu options as described above.
- Click the Continue button to proceed.
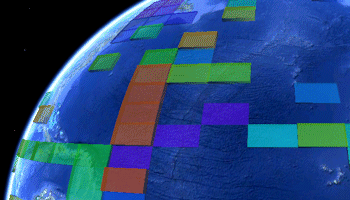
If you've requested that a new model be created, the program will determine the extents of the map, and divide the area into cells using the parameters you entered. For each cell it will compute the requested value (average, sum, etc.). Once the new model has been created, or the existing model loaded, the program will color-code or extrude each cell based on the stored value. It will create a KMZ (zip) file containing the KML file. If requested, the cell model grid file (.RwCMod file) will be saved in the current project folder.
The resulting map will be displayed in Google Earth, if requested.
 Back to Grid Menu Summary
"Google" is a trademark of Google Inc.

RockWare home page