Model-based Profiles: These are available within the RockWorks Borehole Manager's Lithology, Stratigraphy, I-Data, T-Data, P-Data, Fracture, Aquifers and Colors menus. They are used to display a vertical slice from the inside of a solid, stratigraphy, or aquifer model to illustrate lithology distribution, stratigraphic or water level elevations, geochemical/geophysical values, colors, and fracture proximities. Striplogs can be included in any of these profile diagrams. (These programs require RockWorks Standard or higher.)
Log-only Profiles: These are available using the Striplogs | 2-Dimensional | Profile tool which displays multiple boreholes as if projected onto a vertical line of section.
Profile tools are also available within the Utilities | Solid menu, to slice an existing solid model containing any type of data, and the Grid menu to create a line diagram.
Selecting the Profile Location
Importing/Exporting the Profile Location
Selecting the Profile Location
- Select the Profile tool from the Lithology, Stratigraphy, I-Data, T-Data, P-Data, Fractures, Aquifers, Colors, Grid, or Solid menu. Or select 2-Dimensional | Profile from the Striplogs menu.
- Establish the diagram-specific settings using the options which are listed in the left side of the program dialog.
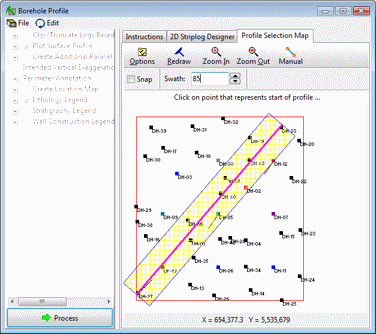
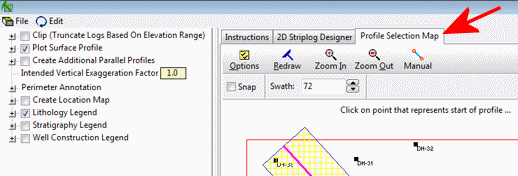
- Click on the Profile Selection Map tab that's displayed to the right of the options.
It will display the well locations as a plan-view map, with boring name and symbol color tied to each well. Any previous profile drawn for this project will also be displayed on the map. (Note: if you are using the Utilities | Solid | Profile tool, only the project boundaries will be displayed, no boreholes.)
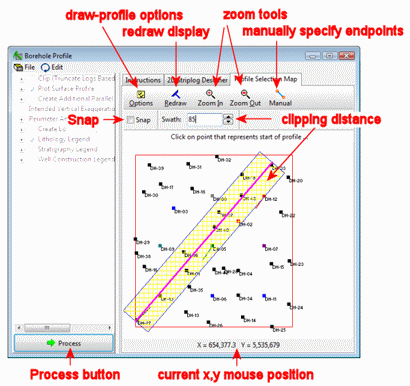
- To accept an existing profile line as-is, simply click the Process button at the bottom of the window to proceed with diagram generation.
- Or, to draw a new profile line, along which the solid model will be sliced and/or onto which the logs will be projected, simply left-click on the map location to become the left edge of the profile and then left-click on the location to become the right edge of the profile. You do not need to refresh the screen between drawing lines. When the line is drawn to your satisfaction, you can click the Process button to create the diagram.
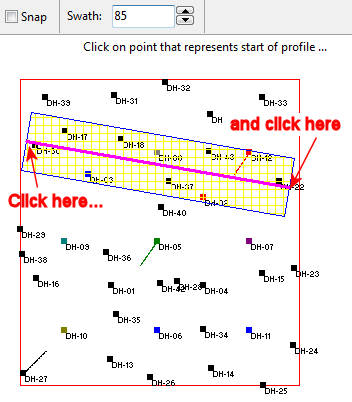
The line can be oriented in the direction of your choice. You may redraw this profile line as many times as you like until you are pleased with its placement. Note that the prompt at the top of the window will prompt you to click on the starting or ending point, to let you know what it's expecting.
- Swath: For profiles containing logs, you can adjust the Swath, shown above by the cross-hatched area. This represents the distance to either side of the actual profile line that boreholes (or portions of boreholes, if the well is deviated) will be "grabbed" for projection onto the line. You can change the clipping distance by clicking the up- or down-arrows at the bottom of the window, or by typing an actual value into the clipping distance prompt. See Excluding Logs or Portions of Logs from the Profile for more info.
- Snap: To snap the profile endpoints to actual well locations, insert a check in the Snap check-box. After you select the profile endpoints, they will be repositioned to the nearest boreholes.
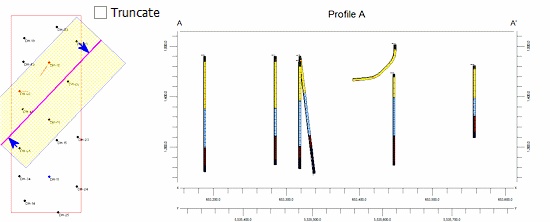
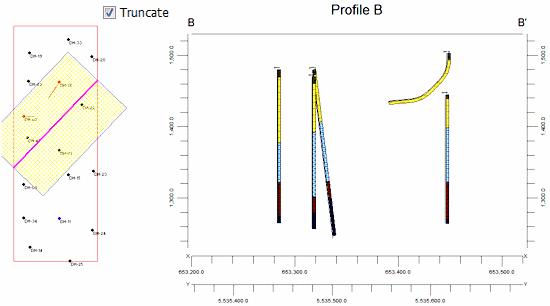
- Truncate: Use this check-box to truncate the profile at the boundary of the project. Compare the following; in Profile A, truncation is off, and the logs on either end are projected onto the line of section even though it extends beyond the project boundary. In Profile B, truncation is turned on, and the profile line stops at the defined project dimensions.
- Manual: If you want to type in specific endpoint coordinates, you can do so: Click the Manual button. Type in the known X and Y coordinates for the beginning and ending points of the profile, and click the Process button. Back at the profile-drawing window, the new profile line will be displayed.
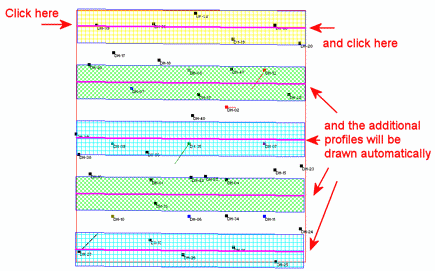
- Multiple Profiles: If you have activated the "Create Additional Parallel Profiles" option, you will see multiple profile lines, offset from the line you drew at the direction and spacing that you've defined in the Options window. The automatic lines will be redrawn each time you redraw your original line; you can adjust the offset, spacing, and maximum distance and redraw as you wish.
- To "zoom in" to a portion of the display:
- Select the View | Zoom In command or click on the
 button at the bottom of the window.
- Draw a rectangular area to be enlarged: Position the pointer on the map display where one corner of the enlarged area should be. Click and hold the left mouse button. Drag the mouse to the opposite corner of the area to be enlarged and release the mouse button. For your reference the enlargement rectangle will be displayed temporarily. When you release the mouse button, the program will magnify the selected map area.
- To "zoom out" of the display:
- Select the View | Zoom Out command or click on the
 button at the bottom of the window. The program will redraw the window to the original display, including all enabled boreholes.
- Note that if the profile line extends beyond the current project dimensions, it will be truncated to the project boundaries. If you would like to be warned that this truncation has taken place, you can activate the Warn if Outside Project setting under the Options menu. See Options for more details.
Importing/Exporting the Profile Location
- To import an existing profile endpoint pair, follow these steps:
! Note that if you've activated multiple parallel profiles, they will be drawn automatically from the single-profile line you import here.
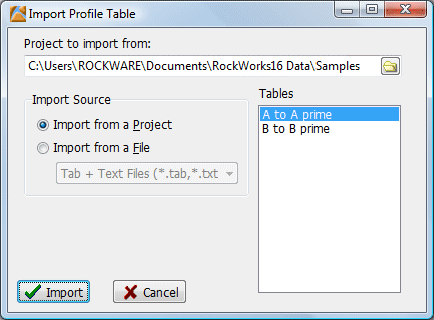
- Click on the File button at the top of the window and select Import.
- Project to import from: Click on the open-button to browse for the project folder which contains the Profile table or text file whose coordinates are to be imported.
- Choose whether you are importing from a Profile table in the project database, or from a text file.
- Import from a Project: Select the name of the Profile table you wish to use, from the Tables list to the right.
- Import from a File: Select the name of the TXT or TAB file that contains the listing of the panel endpoints. This file must comply to this format:
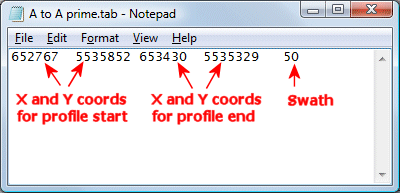
Columns must be separated by Tab characters. The file must be text in format, such as created by Windows notepad.
- Once imported, you'll see the coordinates listed in the Vertices table to the right of the map. You'll also see the represented panels in the display map.
- To export the current profile panel endpoints (for future use, for scripting, etc.):
! Note that if you've activated multiple parallel profiles, the export will store only the first profile that you drew; none of the additional lines will be exported.
- Click on the File button and select Export:
- Database Table: Choose this option to save the profile coordinates to a Profile Table in the project database. This can be used if you build scripts for creating profile diagrams in batch.
- Tab-Delimited ASCII File: Choose this option to save this section trace coordinates to an ASCII tab-delimited file. An example is shown above.

RockWare home page