
RockWorks | Utilities | Solid | Profile
This program is used to read an existing solid model file and create a vertical profile slice anywhere within the model, for display in RockPlot2D. The profile layers can be color-coded in a variety of ways. Axis annotation and a color legend are options.
! Unlike the Profile tools in the Borehole Manager, this Profile tool requires that a solid model file (.RwMod) already exists. This model can be the result of downhole data interpolation in the Borehole Manager, of XYZG data interpolation in the Utilities | Solid | Model option, or of filtering operations elsewhere in the Solid menu.
Menu Options
Step-by-Step Summary
Menu Options
- Model Name: Click to the right to browse for the name of the existing solid model (.RwMod file) to be used for this profile diagram.
- Contour Lines: Insert a check here if you want G-value contour lines to be displayed on the profile panel. Expand this heading to set the contour line options. (More.)
- Colored Intervals: Insert a check here to display G-value distribution on the profile panel with color-filled intervals. Expand this heading to select the desired color scheme, and whether you wish to be prompted to confirm the color intervals. (More.)
- Color Legend: Insert a check to include a legend to the G values and their colors. (More.)
- Plot Surface Profile: Insert a check here to include a line on the profile that represents a user-selected grid model, typically the ground surface. Expand this heading to access the profile options.
- Surface Profile Options: Click the Options button to select the grid model to be represented, and to establish the profile settings. (More.)

- Create Additional Parallel Profiles: Check this box if you want multiple profile lines to be drawn automatically, offset from the profile that you define. Expand this heading to define the direction and spacing of the automatic profile lines, the maximum distance, and diagram labeling options. (More.)

- Show Fault(s): Check this box to display vertical fault lines in the profile, based on the location of one or more fault polylines defined in the project database. (More.)

- Show Infrastructure: Check this box to display buildings, pipes, or other infrastructure with your profile. Click the Options button to define the infrastructure file and plot settings. (More.)
-

- Perimeter Annotation Options: Click this button to establish title, border, and vertical exaggeration settings for the profile. (More.)
-
- Create Location Map: Insert a check here to have the program create, along with the profile, a reference map that shows the profile cut's location. It can be embedded in or created separately from the profile. (More.)
-
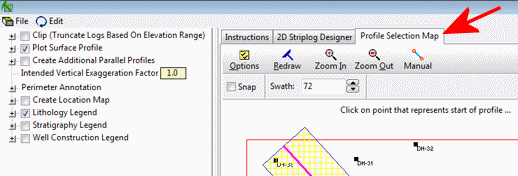
Profile Selection Map: Click on the Profile Selection Map tab to the right, to select where the profile cut (or multiple cuts, if you've requested parallel profiles, above) to be placed. The most recent profile drawn for this project will be displayed. (More.)
If you don't have boreholes in the project, and hence no reference points on the interactive map, you may need to manually enter the specific coordinates for the profile cut.
Step-by-Step Summary
- Access the RockWorks Utilities program tab. It is not necessary to enter data into the main datasheet because RockWorks will not be creating a new solid model.
- Click on the Solid menu and choose Profile.
- Enter the requested menu options, described above.
- Be sure to click on the Profile Selection Map tab to set the profile location.
- Click the Process button to continue.
The program will scan the selected solid model file to determine the model’s dimensions. The program will then look at the coordinates specified for the profile cut and determine the closest nodes along the cut in the existing model. It will construct a vertical profile to illustrate the data values, using the selected color scheme. A profile location map will be appended if requested. The completed diagram will be displayed in a RockPlot2D tab in the Options window.
- You can adjust any of the following items and then click the Process button again to regenerate the profile.
- Profile settings in the Options pane on the left, and/or
- Profile location in the Profile Selection Map tab.
! Each time you click the Process button, the existing profile display will be replaced.
- View / save / manipulate / print / export the profile in the RockPlot2D window.
 Back to Solid Menu Summary

RockWare home page