
RockWorks | Borehole Manager | Striplogs | 2-Dimensional | Projected Section
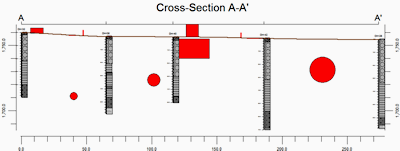
Use this program to create a 2-dimensional display of strip logs of multiple boreholes, displaying observed data currently stored in the borehole data tables. The logs can include any combination of the available log items. The borings are displayed as vertical. The distance between logs is determined by their perpendicular projection onto the section line. The completed projected cross section will be displayed in the RockPlot2D window.
This type of cross section is very handy for projects when the desired cross section location is not specific to the borehole locations, but to another geographic features (roadway, etc.).
See also:
Menu Options
Step-by-Step Summary
Menu Options
- Plot Striplogs: Insert a check here to include individual log diagrams in the projected section. (Don't turn this off if you're not plotting the correlations, below.) Be sure to click on the 2D Striplog Designer tab (to the right, and discussed below) to set up the log layout.
- Show Collar Distances: Check this box to include small labels above each log, which indicates the distance between the log and the plane of section.
- Vertical Tick Mark Height: Click to the right to type in the size for the vertical tick marks, as a percent of the project size.
- Font Size: Click to the right to type in the size for the distance labels, as a percent of the project size.
- Decimal Places: Click to the right to enter the number of decimal places to be used in the distance labels.
- Label Orientation: Expand this heading to select from vertical, angled, or horizontal labels.
- Plot Correlations: Use these settings to plot "quick" projected section correlation panels.
 Stratigraphy: Insert a check in this box to display stratigraphic layers with straight-line correlations between boreholes. Expand this heading to select the correlation style.
- Lines Only: Choose this option to plot straight lines connecting like formations in adjacent logs.
- Patterns Only: Choose this option if you want the stratigraphic correlations to be drawn with lines, with the panels filled with formation patterns against a white background. The patterns are read from the Stratigraphy Types Table. The patterns are plotted in the background colors declared for the pattern blocks.
- Colors Only: Choose this option if you want the stratigraphic correlation to be drawn with lines, with the panels filled with formation colors. The colors are defined in the current Stratigraphy Types Table as the background colors for the pattern blocks.
- Patterns + Colors: Choose this option if you want the stratigraphic correlations to be drawn with lines, with the panels filled with formation colors and patterns. The background colors, and the pattern design and colors are defined in the active Stratigraphy Types Table.
- Label Contacts for Partially Defined Intervals: Check this box to include labels on correlation panels for inferred units, as established by the Rules and Filters settings on the far right side of the program window. (More.)
- I-Data: Choose this to include "quick" correlation panels for a selected track of I-Data between holes.
For I-Data, the program creates the panels by creating 2D grid models between the logs, and color- and/or line-contouring using the settings defined below. This is different from I-Data | Section diagrams which are sliced from within a solid model.
- I-Data Track: Click to the right to choose the I-Data track whose values are to be interpolated into the quick-section panels.
-

- P-Data: Choose this to include "quick" correlation panels for a selected track of P-Data between holes.
For P-Data, the program creates the panels by creating 2D grid models between the logs, and color- and/or line-contouring using the settings defined below. This is different from P-Data | Section diagrams which are sliced from within a solid model.
- P-Data Track: Click to the right to select the P-Data column whose values are to be interpolated into the quick-section panels.

- I-Data & P-Data Section Options: These define the appearance of I-Data or P-Data panels.
- Contour Lines: Insert a check here if you want G-value contour lines to be displayed on the section panels. Expand this heading to set the contour line options. (More.)
- Colored Intervals: Insert a check here to display G-value distribution on the profile panel with color-filled intervals. Expand this heading to access the color contour settings. (More.)
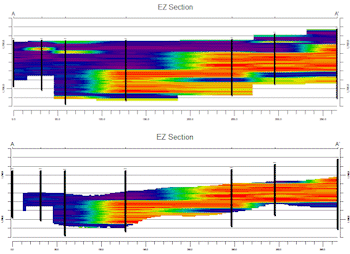
- Surface Based Truncation Filters: By default the quick-correlation panels are created to the vertical extents of the measurements themselves. You can use these settings to truncate the panels based on one or more grid surfaces. These RwGrd files can represent the ground surface, formation tops and bases, etc. In the picture below, the upper section is not clipped; the lower section was clipped with formation surfaces (generated with the Stratigraphy menu programs).
- Upper Surface Filter: Check this box if you want to clip the top of the EZ correlation panels with a grid surface. Expand this heading to define the name of the grid model.
- Grid Model: Click to the right to browse for the name of the RwGrd file to be used to clip the top of the panels.
- Lower Surface Filter: Check this box if you want to clip the base of the EZ correlation panels with a grid surface. Expand this heading to define the name of the grid model.
- Grid Model: Click to the right to browse for the name of the RwGrd file to be used to clip the base of the panels.
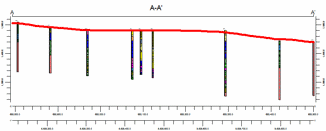
- Plot Surface Profile: Insert a check here to include a line on the projected section that represents a user-selected grid model, typically the ground surface. Expand this heading to access the line profile options.
- Surface Profile Options: Click the Options button to select the grid model to be represented, and to establish the profile settings. (More.)
- Show Fault(s): Check this box if you want to display vertical lines in the output diagram where the projected section slice intersects the fault(s) defined in a project Faults Table.
- Expand this heading to set up the fault lines. (More.)
- Show Infrastructure: Check this box to display buildings, pipes, or other infrastructure with your cross section. Click the Options button to define the infrastructure file and plot settings. (More.)
-
- Perimeter Annotation Options: Click this Options button to establish title, border, and vertical exaggeration settings for the projected section diagram. (More.)
-
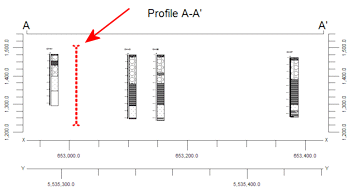
- Create Location Map: Insert a check here to have the program create, along with the projected section diagram, a reference map that shows the location of the section panels. It can be embedded in or created separately from the cross section diagram.
- Expand this heading to establish the map options. (More.)
- Legends:
- Aquifer Legend: If you're including a water level column in your logs, you can insert a check here to include a legend that lists all of the aquifer names and their colors and patterns, as listed in the project's Aquifer Types Table. Expand this item to set the legend size, appearance, and other options. (More.)
- Lithology Legend: If you're including a lithology column in your logs, you can insert a check here to include a legend that lists all of the lithology keywords and their colors and patterns, as listed in the project's Lithology Types Table. Expand this item to set the legend size, appearance, and other options. (More.)
- Stratigraphy Legend: If you're including a stratigraphy column in your logs, you can insert a check here to include a listing of the formation names along with their represented patterns/colors, as listed in the project's Stratigraphy Types Table. Expand this item to establish the size, appearance, and other options. (More.)
- Well Construction Legend: If you're including a well construction column in your logs, you can insert a check here to include a listing of the well construction material names along with their represented patterns/colors, as listed in the project's Well Construction Type Table. Expand this item to establish the size, appearance, and other options. (More.)
- 2D Striplog Designer: Click on the 2D Striplog Designer tab to the right, to select the items to display in the individual logs in the projected section.
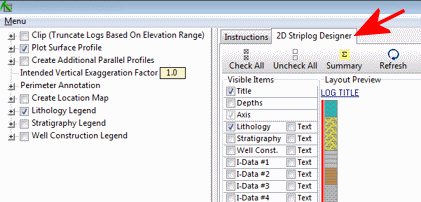
- Visible Items: Use the check-boxes in the Visible Items column to select which log items are to be displayed. See Visible Item Summary for information about the different log items.
- Options: Click on any of the Visible Items names to see the item's settings in the Options pane to the right. See the Visible Item Summary for links to the Options settings.
- Layout Preview: For each item you've activated, you'll see a preview cartoon in the upper pane. Click and drag any item to the left or right to rearrange the log columns. See Using the 2D Log Designer.
- Projected Section Selection Map: Click on the Projected Section Selection Map tab to the right, to select where the section cuts are to be placed. The most recent section drawn for this project will be displayed. (More.)

- Rules and Filters: Use the settings on the far right side of the window to apply stratigraphic rules, date filters, and/or spatial filters to data being displayed in your logs. (More.)
Step-by-Step Summary
Follow these steps to create a 2D diagram that illustrates multiple strip logs projected as vertical holes onto multiple section lines.
- Access the Borehole Manager program tab.
- Enter/import your data into the Borehole Manager database.
- Select the Striplogs | 2-Dimensional | Projected Section menu command.
- Establish the diagram settings, as described above.
- Be sure to click on the 2D Striplog Designer tab to establish how you want the logs to look.
- Be sure to click on the Projected Section Selection Map tab to define the section location.
- Click on the Process button at the bottom of the window to create the striplog section diagram.
The program will create an individual strip log of those borings that were flagged as enabled and which were included in any distance clipping. Only the log items you have activated will be displayed in the logs. The logs will be "projected" perpendicularly onto the section line cuts, and any additional diagram settings that you requested will be included. The projected section will be displayed in a RockPlot2D tab in the Options window.
- You can adjust any of the following items and then click the Process button again to regenerate the diagram.
- Section settings in the Options pane on the left, and/or
- Rules and Filter settings in the pane to the right, and/or
- Striplog settings in the 2D Striplog Designer tab, and/or
- Section location in the Projected Section Selection Map tab.
! Each time you click the Process button (or the <Enter> key on your keyboard), the existing display will be replaced.
! Tip: You can undock the plot window using the  button.
- View / save / manipulate / print / export the projected section in the RockPlot2D window.
 Back to StripLogs Menu Summary

RockWare home page