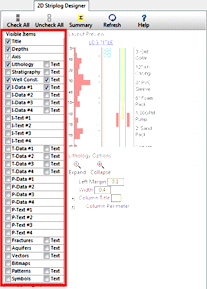
When you click on the 2D Striplog Designer tab, you'll see a window where you can establish which data items will be displayed in the logs, their relative placement in the log, and their appearance settings. This topic discusses the Visible Items.
Menu Options
| Visible Items |
Description, options |
|
| Title | Plots the borehole's name at the top and/or base of each log. The title is always aligned with the log axis. (More.) | |
| Borehole Symbols | Plots the borehole's map symbol at the top and/or base of each log. (More.) | |
| Depths | Plots depth labels down the logs. Settings include labeling interval, font style, etc. (More.) | |
| Axis | The axis is always on. It serves as the center point for the log, above which the main log title will plot (if activated). In cross sections, the location of the axis will represent the actual well location. Options: line style, thickness, and color | |
| Lithology | Plots a column in each log containing intervals of pattern and color that correspond to observed lithology material types. The pattern <-> rock type association is made in the Lithology Types Table. (More.) | |
| Lithology | Text | Plots the lithology keywords, depths, thickness, and/or comments. (More.) |
| Stratigraphy | Plots a column in each log containing intervals of pattern and color that correspond to formation names listed in the Stratigraphy data table. The pattern <-> stratigraphy name association is made in the Stratigraphy Types Table. (More.) | |
| Stratigraphy | Text | Plots the formation names, depths, and/or thickness. (More.) |
| Well Construction | Plots a column in each log displaying intervals of pattern and color that correspond to well construction material names in the Well Construction data table. The pattern + material name association is made in the Well Construction Types table. (More.) | |
| Well Construction | Text | Plots the construction material captions, depths, and/or thickness. (More.) |
| I-Data #1, I-Data #2, I-Data #3, I-Data #4 |
Plots a bargraph representing data read from the I-Data (Intervals) data table. Options include the data source, scaling, colors, etc. (More.) | |
| I-Data | Text | Plots the selected I-Data measurements as numeric text labels within a column. (More.) |
| I-Text #1, I-Text #2, I-Text #3, I-Text #4 |
Plots entries from the I-Text (Interval Text) data table as alphanumeric text labels within a column. (More.) | |
| T-Data #1, T-Data #2, T-Data #3, T-Data #4 |
Plots a bargraph representing data read from the T-Data (Time Intervals) data table. Options include the data source, date range, scaling, colors, etc. (More.) | |
| T-Data | Text | Plots the selected T-Data measurements and/or dates as numeric text labels within a column. (More.) |
| P-Data #1, P-Data #2, P-Data #3, P-Data #4 |
Plots a point to point curve, with or without fill, representing data read from the P-Data (Points) data table. Options include the data source, colors, curve style, etc. (More.) | |
| P-Text #1, P-Text #2, P-Text #3, P-Text #4 |
Plots entries from the P-Text (Point Text) data table as alphanumeric text labels within a column. (More.) | |
| Fractures | Reads measurements from the Fractures table and plots a tadpole column representing the fracture orientation and dip. Options include colors, title, etc. (More.) | |
| Fractures | Text | Plots the fracture measurements as text labels within a column (More.) |
| Aquifers | Plots color- and pattern-filled blocks representing depth to aquifer top and base declared in the Water Levels table, for all aquifers, for selected dates in each log. Options include block width, and whether date and/or name captions should be plotted. (More.) | |
| Aquifers | Text | Plots the Water Level measurements and/or aquifer names as text labels within a column (More.) |
| Vectors | Reads Vector data and plots a tadpole column representing the vector orientation and dip. Options include colors, title, etc. (More.) | |
| Vectors | Text | Plots the vector measurements as text labels within a column (More.) |
| Colors | Plots user-selected color blocks between specific depths in each log, as read from the Colors data table. (More.) | |
| Bitmaps | Plots downhole raster images in vertical 2D logs. Options include imbedding versus linking the image, transparency, and including a border. (More.) | |
| Patterns | Plots user-selected pattern blocks between specific depths in each log, as read from the Patterns data table. These are commonly used to show screened intervals, and they have a variety of options. (More.) | |
| Patterns | Text | Plots the pattern captions as text labels within a column. (More.) |
| Symbols | Plots user-selected symbols at specific depths in each log, as read from the Symbols data table. These are commonly used to display water level symbols. There are a variety of special-symbol options. (More.) | |
| Symbols | Text | Plots the symbol captions as text labels within a column. (More.) |
| Misc Options | Shared I-Data and T-Data settings (More.) | |
See also: Using the 2D Log Designer
![]() Back to 2D Striplog Overview
Back to 2D Striplog Overview
![]()