RockWorks | Utilities | EarthApps | Lines Menu
Use the programs in the EarthApps Lines menu to read line segment or polyline endpoints from the Datasheet Editor and plot these lines in Google Earth. This topic summarizes the tools that are available - click on a link or picture for more information.
Table of Contents
 Back to EarthApps Summary
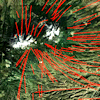
Lines: Lines are plotted between X1Y1, X2Y2 endpoints in 2D or 3D, in constant or variable colors.
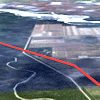
- 2D (Simple): Lines are plotted between the X1Y1, X2Y2 endpoints in a constant color and thickness, clamped to the ground.
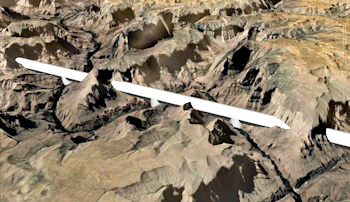
- 3D (Simple): Line segments are drawn between X1Y1Z1, X2Y2Z2 endpoints in a constant color and thickness, with the lines plotted at absolute or relative elevations.
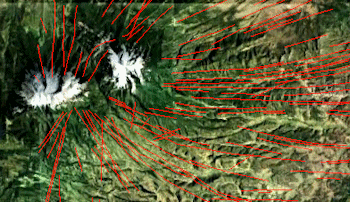
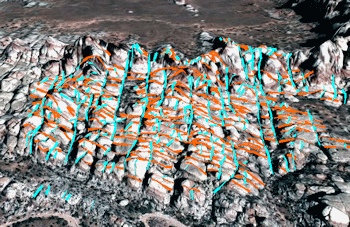
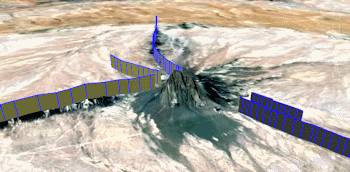
- 2D/3D (Advanced): Line segments are drawn between the X1Y1, X2Y2 endpoints using fixed or variable colors and thicknesses, with the lines plotted along the ground, relative to the ground, or at a fixed elevation. Lines can be "extruded" down to the ground like fence panels.
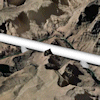
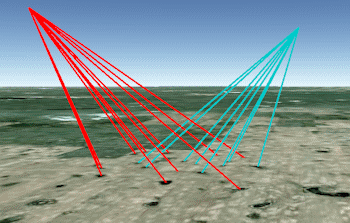
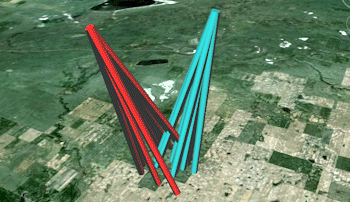
Tubes: Tubes are plotted between X1Y1Z1, X2Y2Z2 endpoints in 3D, in constant or variable colors. These are single-segment tubes; they differen from Pipelines, by allowing elevation definitions.
- Simple: Tubes are plotted between the X1Y1, X2Y2 endpoints in a constant color and thickness, clamped to or relative to the ground, or at absolute elevations.
- Advanced: Tubes are drawn between the X1Y1Z1, X2Y2Z2 endpoints using fixed or variable colors and thicknesses, along the ground, relative to the ground, or at a fixed elevation.
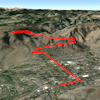
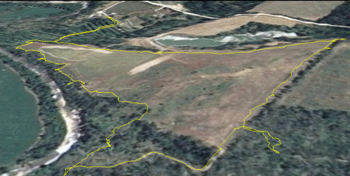
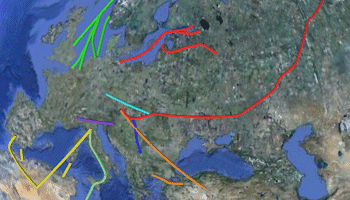
Polylines: Plot one or more multi-segmented lines; 3D "extrusion" as panels is available.
- Single: A single polyline is plotted, with XY and (optionally) Z coordinates read from the Datasheet editor.
- Multiple: Multiple polylines can be plotted, read from individual XY(Z) files.
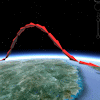
Parabolas: Plot one or more multi-segmented 3D parabolas.
- Arrows: The parabolas are drawn as segmented 3D arrows, between two geographic locations (X1Y1, X2Y2) read from the datasheet editor.

- Lines: The parabolas are drawn as continuous polylines, between two geographic locations (X1Y1, X2Y2) read from the datasheet editor.
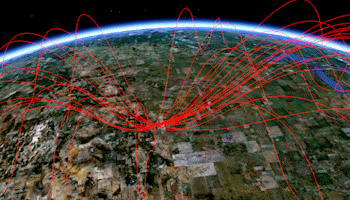
- Tubes: The parabolas are drawn as continuous tubes, between two geographic locations (X1Y1, X2Y2) read from the datasheet editor.

Pipelines: Plot one or more multi-segmented 3D pipelines.
- Single: A single pipeline is plotted, with XY coordinates read from the Datasheet editor.

- Multiple: Multiple pipelines can be plotted, read from individual .rwDat files which list XY coordinates.
Back to EarthApps Summary
"Google" is a trademark of Google Inc.

RockWare home page