RockWorks | Utilities | Solid | Statistics | Standardize
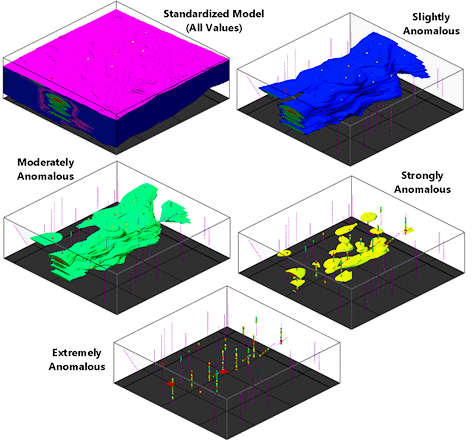
Use this program to convert all of the non-null node (G) values within a block (solid) model such that new G-values represent the number of standard-deviations from the mean value. The result is an anomaly model.
In the above graphic, we've used this terminology: Slightly Anomalous is > 1 (Mean +/- 1 Standard Deviation), Moderately Anomalous is > 2 (Mean +/- 2 Standard Deviations), Strongly Anomalous is > 3 (Mean +/- 3 Standard Deviations), Extremely (aka Outrageously, Insanely, X-Treme) Anomalous is > 4 (Mean +/- 4 Standard Deviations).
! This tool requires that the solid model being standardized already exists.
See also the Normalize option for a program which converts solid model node values to a new, normalized value range.
Menu Options
Step-by-Step Summary
Menu Options
- Input Model: Click to the right to browse for the name of the existing solid model file (.RwMod) to be processed.
- Output Model: Click to the right to type in the name to assign to the new solid model whose nodes will represent standard deviations from the mean.
- Compute Absolute Values: Check this box if the negative standard deviations are to be stored as absolute values. This allows high and low anomalies (standard deviations) to be compared together. Leave this box unchecked to stored the original standard deviation values.
- Set Background Values to Zero: Check this box if the source-model values considered "background" are to be assigned a value of 0. Expand this heading to define the real number value below which nodes are to be reclassified as zero.
! Tip: Use the Solid | Statistics | Histogram to create a frequency histogram of the node values in the (source) input model, where you can view their distribution and statistics.
- Create 3-Dimensional Diagram: Insert a check here to display the output model as a 3D diagram. Expand this heading to establish the diagram options.
- Diagram Type: Choose from one of the following. (More.)
- All Voxels: Click in the All Voxels radio button to represent the solid model in the 3D display as color-coded voxels. You can choose to display either the Full Voxel, or just the Midpoint. Display of the midpoint only can significantly improve display time for huge models.
- Isosurface: Click in the Isosurface radio button to display the solid model as if enclosed in a "skin." This view will be smoother than a voxel display.
- Iso-Mesh: Use this option to plot a series of polylines that represent three-dimensional contours at a user-defined cutoff. Expand the heading to establish the settings. (More.)
- Color Scheme: Click on the Options button to define the display's color scheme - automatic, table-based, etc. (More.)
- Reference Cage: Insert a check here to include vertical elevation axes and X and Y coordinate axes in the 3D diagram. Expand this item to set up the cage items. (More.)
- Include Legend: Insert a check here to include an index to the colors and G values in the diagram. (More.)
Step-by-Step Summary
- Access the RockWorks Utilities program tab.
- Select the Solid | Statistics | Standardize menu option.
- Enter the requested menu settings, described above.
- Click the Process button to continue.
The program will read the node values from the input model. It will determine the G value range of the nodes and calculate the mean and standard deviations. Each node value will be converted to its standard deviation, which will be saved under the output model name.
If you requested a diagram, the model will be displayed in a RockPlot3D tab in the Options window, using the requested display type.
 Back to Solid Menu Summary

RockWare home page