RockWorks offers the following "layers" for three-dimensional isosuface diagrams, such as those generated by the Borehole Manager I-Data | Model option, or the Utilities Solid | Model option. A layer is activated if a check-mark is displayed in its check box. To access the layer's settings, expand its sub-topics by clicking on its "+" button.
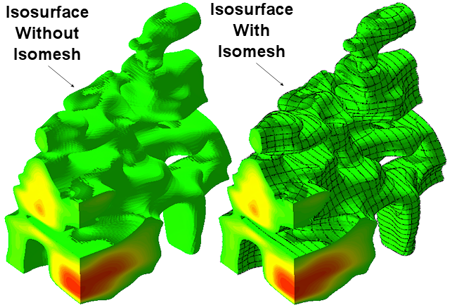
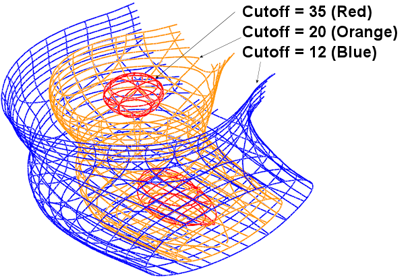
Iso-Mesh: Insert a check in this box to plot a series of polylines that represent three-dimensional contours at a user-defined cutoff. By plotting these lines in conjunction with an isosurface, a more distinct diagram is displayed:
Color: This defines the color that is used to plot the isosurface (see previous example).
Thickness: This defines the line thickness that is used when plotting the isomesh isolines. A setting of "1" will generate thin lines, while a setting of "3" will generate thick lines.
Smoothing: This defines the level of smoothing that is applied to the isolines (zero = no smoothing). The effect of smoothing is typically negligible except for extremely coarse models.
Horizontal Sampling Interval: A setting of "1" will plot a contour for each layer within the solid model. A setting of "2" will skip every other layer, A setting of "3" will sample every third layer, and so on.
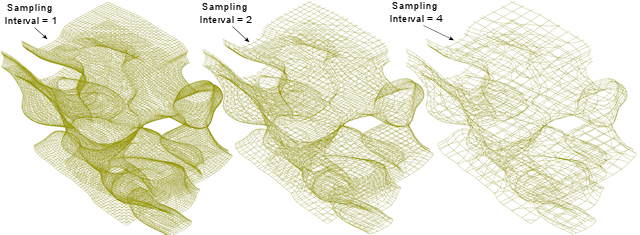
Vertical Sampling Interval: The east/west and north/south profiles within an isomesh represent vertical slices of the block model. This setting tells the program how many rows to skip, similar to the Horizontal Sampling Interval.
![]()