RockWorks | Utilities | Solid | Statistics | Normalize
Use this program to convert all of the non-null node (G) values within a block (solid) model such that they range between two user-specified numbers.
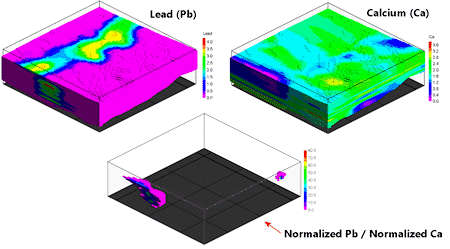
This is commonly used when comparing apples and oranges - e.g. looking for a spatial relationship between two types of geochemistry. By normalizing the two models to the same range (e.g. 1.0 and 2.0) and then dividing one by the other, we can see where they're spatially related (i.e. the regions where the g-values are closest to 1.0).
! This tool requires that the solid model being normalized already exists.
See also the Standardize option for a program which converts solid model node values to standard deviations.
Menu Options
Step-by-Step Summary
Menu Options
- Input Model: Click to the right to browse for the name of the existing solid model file (.RwMod) to be processed.
- Output Model: Click to the right to type in the name to assign to the new, normalized model.
- New Minimum Value: Click to the right to type in the real number value which is to correspond to the lowest value in the input model.
- New Maximum Value: Click to the right and enter the real number value to correspond to the highest value in the input model.
- Create 3-Dimensional Diagram: Insert a check here to display the output model as a 3D diagram. Expand this heading to establish the diagram options.
- Diagram Type: Choose from one of the following. (More.)
- All Voxels: Click in the All Voxels radio button to represent the solid model in the 3D display as color-coded voxels. You can choose to display either the Full Voxel, or just the Midpoint. Display of the midpoint only can significantly improve display time for huge models.
- Isosurface: Click in the Isosurface radio button to display the solid model as if enclosed in a "skin." This view will be smoother than a voxel display.
- Iso-Mesh: Use this option to plot a series of polylines that represent three-dimensional contours at a user-defined cutoff. Expand the heading to establish the settings. (More.)
- Color Scheme: Click on the Options button to define the display's color scheme - automatic, table-based, etc. (More.)
- Reference Cage: Insert a check here to include vertical elevation axes and X and Y coordinate axes in the 3D diagram. Expand this item to set up the cage items. (More.)
- Include Legend: Insert a check here to include an index to the colors and G values in the diagram. (More.)
Step-by-Step Summary
- Access the RockWorks Utilities program tab.
- Select the Solid | Statistics | Normalize menu option.
- Enter the requested menu settings, described above.
- Click the Process button to continue.
The program will read the data values from the input model. It will determine the range of G values in the model and convert them to range between the New Minimum and Maximum Values assigned above. The converted node values will be stored under the specified output model name.
If you requested a diagram, the model will be displayed in a RockPlot3D tab in the Options window, using the requested display type.
 Back to Solid Menu Summary

RockWare home page