
RockWorks | Utiliites | Solid | Projected Section
This program is used to:
- Read an existing .RwMod file you've already created.
- "Slice" this model along any path and create a 2D cross section diagram. Because the model is interpolated across the entire project, you can place the section panels anywhere you like. The section panels can be color-coded in a variety of ways.
- Project vertically onto the section panels the logs for boreholes which lie a specified distance from the section (if requested).
- Display the completed profile in RockPlot2D.
! Unlike the Section tools in the Borehole Manager, this Section tool requires that a solid model file (.RwMod file) already exists. This model can be the result of downhole data interpolation in the Borehole Manager, of XYZG data interpolation in the Utilities | Solid | Model option, or of filtering operations elsewhere in the Solid menu.
! This program differs from the Solid | Section program in that logs are projected onto the section panels rather than being plotted at the closest panel endpoint and will apply only to users of who have data entered into the Borehole Manager database.
Menu Options
Step-by-Step Summary
Menu Options
- Model Name: Click to the right to locate the name of the existing solid model (.RwMod file) to be used for this section diagram
- Contour Lines: Insert a check here if you want G-value contour lines to be displayed on the section panels. Expand this heading to set the contour line options. (More.)
- Colored Intervals: Insert a check here to display G-value distribution on the section panels with color-filled intervals. Expand this heading to select the desired color scheme, and whether you wish to be prompted to confirm the color intervals. (More.)
- Color Legend: Insert a check to include a legend to the G values and their colors. (More.)
- Plot Logs: If you would like for the program to append striplogs to your section diagram, insert a check here. This requires that you have data entered into the Borehole Manager database.
! NOTE: Logs which lie within a defined distance from the section will be projected perpendicularly onto the section panels. Logs are always displayed vertically.
-
- Clip Logs: Check this sub-item if you want to restrict the logs to a particular elevation range. This should match the elevation range of the solid model you selected as input, above. (More.)
- 2D Striplog Designer: Click on the 2D Striplog Designer tab to the right, to select the items to display in the individual logs to overlay the section.
-
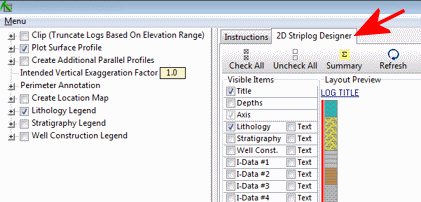
- Visible Items: Use the check-boxes in the Visible Items column to select which log items are to be displayed. See Visible Item Summary for information.
- Options: Click on any of the Visible Items names to see the item's settings in the Options pane to the right. See the Visible Items Summary, above, for links to the Options settings.
- Layout Preview: For each item you've activated, you'll see a preview cartoon in the upper pane. Click and drag any item to the left or right to rearrange the log columns. See Using the 2D Log Designer.
- Plot Surface Profile: Insert a check here to include a solid line profile on the profile panel that represents a user-selected grid model, typically the ground surface.
- Grid Model: Expand this heading to select the grid model to be represented, and to establish the profile settings. (More.)
- Show Fault(s): Check this box to display vertical fault lines in the profile, based on the location of one or more fault polylines defined in the project database. (More.)

- Show Infrastructure: Check this box to display buildings, pipes, or other infrastructure with your section. Click the Options button to define the infrastructure file and plot settings. (More.)
-

- Perimeter Annotation Options: Click this button to establish title, border, and vertical exaggeration settings for the section. (More.)
-
- Create Location Map: Insert a check here to have the program create, along with the section, a reference map that shows the section's trace. It can be embedded in or created separately from the cross-section. (More.)
-
Projected Section Selection Map: Click on the Projected Section Selection Map tab to the right, to draw where the cross section panels are to be placed and define the projection "swath" distance. The most recent section drawn for this project will be displayed. (More.)
If you don't have boreholes in the project, and hence no reference points on the interactive map, you may need to import a list of the specific coordinates for the section panels.

Step-by-Step Summary
- Access the RockWorks Utilities program tab. It is not necessary to enter data into the main datasheet because RockWorks will not be creating a new solid model.
- Select the Solid | Projected Section menu option.
- Enter the requested menu settings, described above.
- If you are including logs with the diagram, be sure to click on the 2D Striplog Designer tab to establish how you want the logs to look.
- Click on the Projected Section Selection Map tab to establish the section location and the "swath" distance to either side, within which borehole logs will be included in the diagram.
- Click the Process button to proceed.
The program will scan the selected solid model file to determine the model’s dimensions. The program will then look at the coordinates specified for the section panels and will construct a vertical profile of each to illustrate the data values, using the selected color scheme. The panels will then be appended together to create the multi-panel section. If requested, logs will be projected onto the section panels and a section location map will be appended. The completed diagram will be displayed in a RockPlot2D tab in the Options window.
- You can adjust any of the following items and then click the Process button again to regenerate the section.
- Diagram settings in the Options pane on the left, and/or
- Section location in the Projected Section Selection Map tab.
! Each time you click the Process button, the existing display will be replaced.
- View / save / manipulate / print / export the diagram in the RockPlot2D window.
 Back to Solid Menu Summary

RockWare home page