RockWorks | Borehole Manager | Fractures | Rose Diagram
This program reads fracture data for the current borehole and generates a directional diagram that depicts the orientations of the features.
See also: Creating Rose Diagram Maps
Feature Level: RockWorks Standard and higher
Menu Options
Step-by-Step Summary
Menu Options
- Petal Radii and Annotation Based On... Use these options to define what the petal length is to represent. (See examples.)
- Frequency (Occurrences Per Bin): Choose this option if the petals are to represent the number of measurements in each bin.
- Frequency % (Frequency as % of Total Population): Choose this option if the petals are to represent the percent of all measurements represented in each bin.
- Azimuth Filter: Expand this item to activate one or both bearing filters by inserting a check in the check box(es).
- (More.)
- Diagram Style: Select either Full for a full, 360-degree rose, or Half for a northern-half rose.
- Rotate: Insert a check in this box to turn on data rotation. Expand this heading to enter the amount in degrees clockwise from North (0 to 360) by which each measurement should be rotated. (More.)
- Bi-directional: To specify that your data be considered bi-directional in nature, insert a check in the Bi-directional check-box. If the data is uni-directional, be sure that this box is cleared. (More.)
- Circles: To include concentric reference circles (full rose diagrams) or arcs (half rose diagrams) that signify percent or occurrences, insert a check in the Circles check-box. Expand this item to select circle settings. (More.)
- Rays: Check this box to include reference rays, which extend from the center of the rose outward. Expand this item to set the color and ray spacing in degrees. (More.)
- Petals: To turn on the plotting of the rose petals, insert a check in the Petals check-box. Expand this item to set the petal options. (More.)
- Mean Ray: Insert a check in this box to turn on the plotting of the mean vector ray, which represents the mean vector computed from your data set. Expand this item to select the line style and color, and whether arrowheads are to be included. (More.)
- Mean Error: Insert a check here to activate the plotting of an arc that represents the interval around the vector mean that most likely contains the true population mean direction. Expand this item to select the line style and color, and the confidence interval.
- (More.)
- Title: To turn on the plotting of a title, insert a check in this check-box. Expand this item to enter the title text (40 characters maximum), color, and text size (expressed as a percent of the diagram width).
- Legend: Insert a check here to include a legend in the diagram. This legend lists computed statistics and some diagram settings. Expand this item to set the legend dimensions, border style, title, text color, and more.
- (More.)
- Maximum Diameter: Choose whether the maximum diameter of the rose should be the longest petal or the outermost reference circle. (More.)
- Minimum Diameter: Click to set the inside diameter for the rose. This permits you to create an inner "ring" that contains no lines or color fill. This radius value is declared as a percent of the diagram size. Default = 0.25. (More.)
Step-by-Step Summary
- Access the RockWorks Borehole Manager program tab.
- Enter/import your fracture data.
- Click on the name of borehole for which you wish to create the rose diagram, to make it active.
- Select the Fractures | Rose Diagram menu option.
- Enter the requested menu settings, described above.
- Click the Process button to proceed.
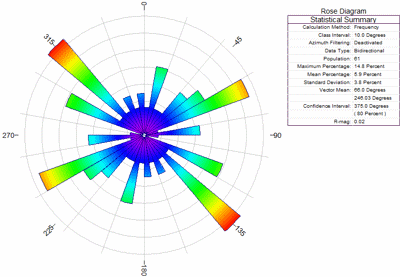
The program will generate a rose diagram that depicts the orientations of the fracture bearings based on the input data and plotting parameters. The diagram will be displayed in a RockPlot2D tab in the Options window.
- You can adjust any of the options along the left and click the Process button to regenerate the diagram.
! Each time you click the Process button, the existing display will be replaced.
- View / save / manipulate / print / export the diagram in the RockPlot2D window.
 Back to Fracture Menu Summary

RockWare home page