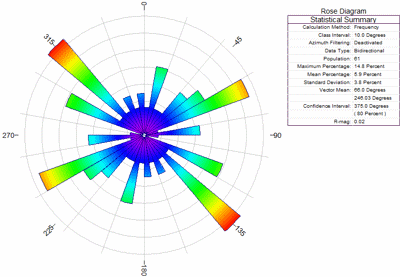
These settings pertain to rose diagrams created in the RockWorks Utilities Grid and Linears menus and in the RockWorks Borehole Manager Fractures menu.
Menu Options
- Diagram Style: Select either Full for a full, 360-degree rose, or Half for a northern-half rose.
- Type of Analysis - Petal Radii & Annotation Based On... Click on this tab to access these options which will determine what the petal lengths will represent.
-
- Frequency:
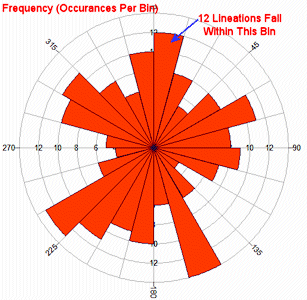
- Occurrences per Bin: With this option, the length of the rose petal will represent the number of occurrences of azimuth measurements that fall within that bin.
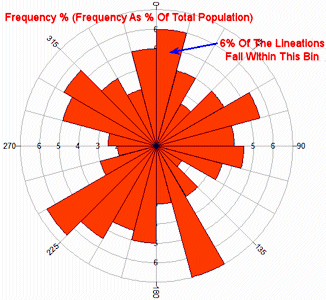
- Percent of Total Population: With this option, the length of the petal will represent the percent of total measurements that fall within this bin.
- Length:
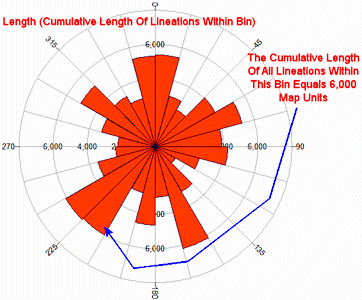
- Cumulative Length of Lineations within Bin: Using this option the petal length represents the total length of the lineations that fall within this bin.
- Length as a Percent of Total Lineation Lengths: This option sets the petal length to represent the percent of total lineation lengths that fall within this bin.
-
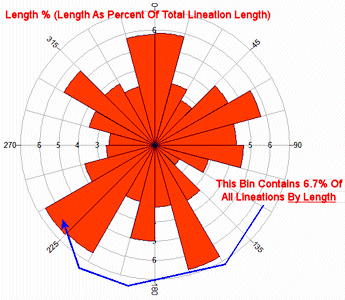
- Minimum Length Filter: Insert a check here to activate a lower length filter for the lineations. To the right, type in the minimum acceptable length, in your input units. Any lineations shorter than this will be omitted from the diagram and computations.
- Maximum Length Filter: Check this box to activate an upper length filter. To the right, type in the maximum acceptable length in your map units. Any lineations longer than this will be omitted from the diagram and computations.
- Azimuth Filter #1: Check this to activate a bearing filter.
-
- Minimum: Enter the minimum lineation or fracture bearing that is to be included in the processing. For this filter, bearings must be entered in degrees (0 - 360) rather than quadrant.
- Maximum: Enter the maximum acceptable lineation bearing. The maximum azimuth must be designated in a clockwise manner from the minimum. If the data are bi-directional in nature, the program will also filter out the data that is 180 degrees opposite the filter specifications.
- Azimuth Filter #2: Check this to activate a second bearing filter.
-
- Minimum: Enter the minimum lineation or fracture bearing that is to be included in the processing. As above, bearings must be entered in degrees (0 - 360) rather than quadrant.
- Maximum: Enter the maximum acceptable lineation bearing. The maximum azimuth must be designated in a clockwise manner from the minimum. If the data are bi-directional in nature, the program will also filter out the data that is 180 degrees opposite the filter specifications.
- Rotate: Insert a check in this box to turn on data rotation. To the right, enter the amount in degrees clockwise from North (0 to 360) by which each lineation measurement should be rotated.
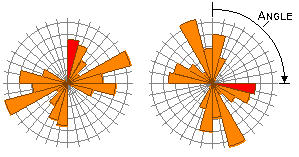
- Bi-directional: To specify that your data be considered bi-directional in nature, insert a check in the Bi-directional check-box. If the data is uni-directional, be sure that this box is cleared.

- Circles: To include concentric reference circles (full rose diagrams) or arcs (half rose diagrams) that signify percent or occurrences or total lengths (depending on the source data), insert a check in the Circles check-box. To the right you can define the circle settings:
-
- Color: Choose the color in which the circles will be drawn.
- Manually-Defined Circle Spacing (vs. Automatic):
- Leave this box UNCHECKED if you want the program to determine automatically the appropriate spacing of the reference circles/arcs based on the range of petal lengths.
- Or, CHECK this box to manually define the circle intervals.
- Spacing: Enter the intervals for the circles, being mindful of the Diameter setting you've selected at the bottom of the window.
- Labels: Insert a check in this box to include labels on the circles. Set the circle label color and size.
-
- Omit Outermost Ring Label: Insert a check here if the outer ring's label is to be omitted. This can be helpful if the ring label and the azimuth labels overplot.
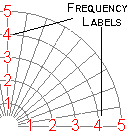
- Rays: Check this box to include reference rays, which extend from the center of the rose outward. To the right you can set the color and ray spacing in real number degrees.
! You may want to make the ray spacing equal to, or an even multiple of, the petal spacing, below.
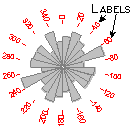
- Labels: If you have activated the plotting of reference rays, you may include labels on them by inserting a check in this check-box. Expand this item to set the label color and size, offset from the ray, and spacing (in real number degrees).
- Petals: To turn on the plotting of the rose petals, insert a check in the Petals check-box. To the right there is a variety of petal options.
-
- Width: Use this setting to establish the petal width in real number degrees. This will determine the size of the class interval grouping of measurements.
- Perimeter Color: Select the petal outline color.
- Perimeter Thickness: Select the line thicknessin pixels.
- Fill Petal Interiors:
-
- Leave this box UNCHECKED for no petal fill.
- CHECK this box to fill the petals with color. Choose the color scheme:
-
- Monochromatic: This option will fill the petals with a single color which you specify.
- Cold-to-hot: This option will fill the petals with different colors.
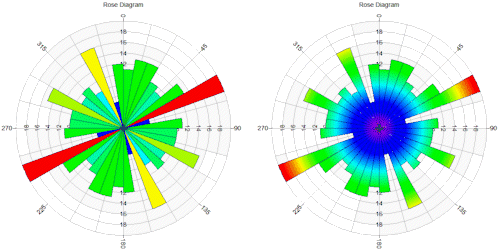
- Monochrome Petals: Choose this option to fill short petals with cold colors and long petals with hot colors, as shown in the left example below.
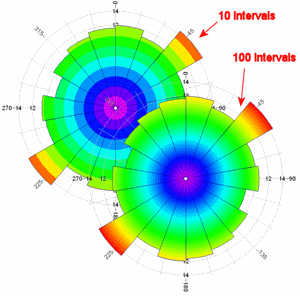
- Banded Petals: Choose this option to have each petal display gradational colors, cold (purples, blues) to hot (oranges, reds). The intervals you establish will determine the number of subdivisions within the petal that will be used to create the gradational effect.
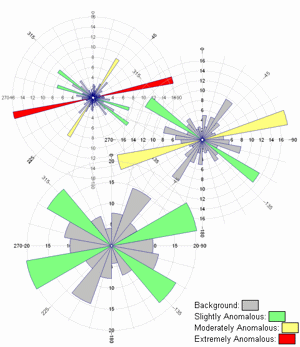
- Statistical Intervals: This option will automatically color the rose petals based upon their statistical magnitude. The colors are assigned as follows:
Background: Magnitude < Mean Percentage + Standard Deviation
Slightly Anomalous: Mean Percentage + Standard Deviation < Magnitude < Mean Percentage + ( Standard Deviation x 2 )
Moderately Anomalous: Mean Percentage + ( Standard Deviation x 2 ) < Magnitude < Mean Percentage + ( Standard Deviation x 3 )
Strongly Anomalous: Direction > Mean Percentage + ( Standard Deviation x 3 )
- Mean Ray: Insert a check in this box to turn on the plotting of the mean vector ray, which represents the mean lineation vector computed from your data set. To the right, select the line style and color, and whether arrowheads are to be included.
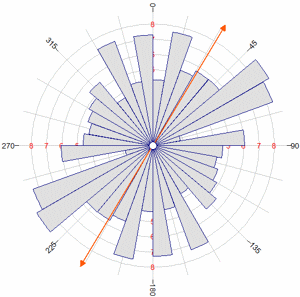
- Mean Error: Insert a check here to activate the plotting of an arc that represents the interval around the vector mean that most likely contains the true population mean direction. Select the line style and color, and the confidence interval.
-
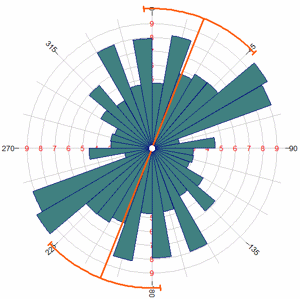
- Confidence Interval: Expand this item to select the desired confidence level. For example, if you choose 95%, this indicates a 95% confidence that the arc contains the true population mean direction. See Error Computations for more information. Note that mean vector and confidence interval are included in the diagram legend.
- Title: To turn on the plotting of a title, insert a check in this check-box. To the right, enter the title text (it will plot on a single line only), color, and text size (expressed as a percent of the diagram width).
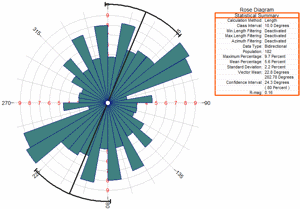
- Legend: Insert a check here to include a legend in the diagram. This legend lists computed statistics and some diagram settings. There are a number of options to the right.
-
- Dimensions & Position
- Width & Height: These are defined as a percent of the width and height of the rose diagram. Default = 40.
- Horizontal & Vertical Offset: These are defined as a percent of the size of the rose diagram, offset from the right edge of the diagram (horizontal) and from the bottom edge of the diagram (vertical).
- Border: Checking this box activates the solid line border around the outer edge of the legend.
- Legend Title: Checking this box activates the plotting of a title at the top of the legend.
- Horizontal Dividers: Check this option to plot horizontal divider lines between legend rows.
- Vertical Dividers: Check this option to plot vertical divider lines between legend columns.
- Left Text Column: Establishes text color and alignment for the left-hand column.
- Right Text Column: Establishes text color and alignment for the right-hand column.
- Diameters
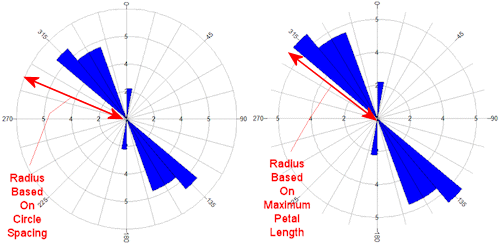
- Maximum Diameter: These scaling settings will primarily affect the scaling of the roses on rose maps.
- Multiple of Circle Spacing: Select this option if the maximum diameter for the rose is to be based on the outer circle.
- Maximum Petal Length: Select this option if the maximum diameter for the rose is to be based on the longest petal.
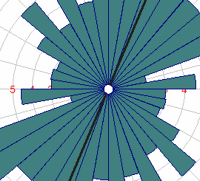
- Minimum Diameter: This setting establishes the inside diameter for the rose. This permits you to create an inner "ring" that contains no lines or color fill. This radius value is declared as a percent of the diagram size. Default = 0.3.
See also:

RockWare home page


