RockWorks | Utilities | EarthApps | Points | Circles | Proportional
This program:
- Reads a listing of data from the Datasheet Editor: XY locations and measured values for any/all of these locations.
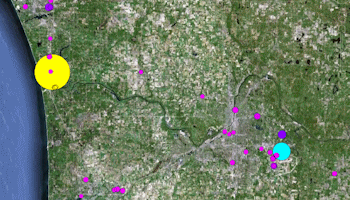
- Creates a KML output file in which the point locations are illustrated with outlined or filled circles, whose radius and color are proportional to the measured values, automatically defined by the program. Labels are optional.
- Creates a KMZ (zip) output file, containing the KML file.
- Loads the KMZ file in Google Earth.
See also: Circle Maps - Simple, Circle Maps - Advanced
Menu Options
Step-by-Step Summary
Menu Options
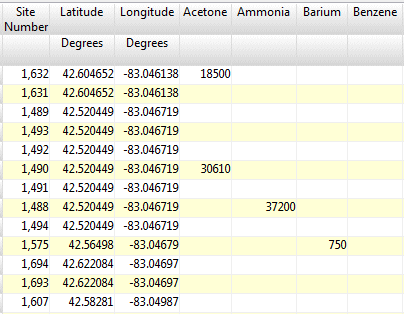
- Input Columns: The prompts along the left side of the window Let RockWorks know which columns in the input datasheet contain the required data.
Click on an existing name to select a different name from the drop-down list. See a sample data layout below.
- X: Column that contains the X coordinates for the points.
These can be Eastings in meters or feet, decimal longitudes, etc. See Defining your Datasheet Coordinates for more information.
- Y: Column that contains the Y coordinates for the points.
- Z: Column that contains the measurements upon which the circles will be scaled and color-coded.
- Circle Radii: Specify the min-max sizes for the circles.
- Minimum Radius (Meters): Defines the radius for the circles, as expressed in meters, for the sample sites with the smallest Z value measurement (as read from the Z column defined above).
For example, an entry of 1000 would create circles that have a radius of 1 kilometer.
- Maximum Radius (Meters): Defines the radius for the circles, in meters, for the sample sites with the largest Z value measurement (as read from the Z column defined above). Sites with intermediate Z values will be scaled proportionally between the minimum and maximum radii.
- Circle Types:
- Filled: Click in this button if you want the circles to be filled with color. The colors will be assigned automatically, using a cold-to-hot color scheme, based on the min-max range of the values for the site listed in the Z column defined above.
- Perimeter Only: Click in this button to plot unfilled circles (perimeter outline only). The colors will be assigned automatically, as described above.
- Thickness (Pixels): Enter "1" for thin outlines, "2" for medium thickness, or "3" for thick outlines.
- Include Labels: Insert a check here to label the site in the Google Earth side panel and in the map.
- Label Column: Defines the column that contains the text to be used for the labels.
Click on the current name displayed to the right, to choose a different column name from the drop-down list. The program will pull the label text from this column.
- Color: Defines the color for the labels.
Click on the current color, displayed to the right, to choose a different color.
- Scale: Defines the size of the labels. Default = 1.
Rule of thumb: 0.5 will create small labels, 2.0 large labels.
Step-by-Step Summary
- Access the Utilities program tab.
- Create a new datasheet and enter or import your location names and coordinates into the datasheet.
Or, open one of the sample files and replace that data with your own. (In this example, the sample file = "RockWorks17 Data\EarthApps Samples\Circles_Proportional_01.rwDat")
Longitude and latitude coordinates must be in decimal format. If you're using another coordinate system, be sure you've specified the Units and the Projection Settings as appropriate.
- Select the RockWorks | Utilities | EarthApps | Points | Circles | Proportional menu option.
- Enter the menu options as described above.
! Tip: If you're working with one of the sample .rwDat files, you can load its specific menu settings by (1) clicking on the Menu button at the top of the window, (2) clicking Load from RCL, and (3) browsing for the .rcl file with the same name as the .rwDat file you're working with.
- Click the Process button to continue.
The program will create a KML file listing the filled or outlined circles at the XY locations. The dimensions and color of the circles will vary depending on the values in the "Z" value column you specify. It will create a KMZ (zip) file containing the KML file. The Google Earth KML and KMZ file names will be assigned automatically.
- If RockWorks displays the KMZ name in a popup window for your reference, you can confirm:
- Automatically load file into Google Earth: Be sure this is checked if you want to display the output at this time.
- Show this message every time a KMZ File is Created: If checked, this window will be displayed each time a Google Earth output is created. Uncheck this if you prefer not to see this window in the future.
(Both of these settings are also available via the Preferences menu.)
- Click OK to continue or Cancel to cancel the operation.
The resulting map will be displayed in Google Earth, if requested.
 Back to Point Map Summary
"Google" is a trademark of Google Inc.

RockWare home page