All of the point-mapping tools in the RockWorks Utilities (Map | EZ Map, etc.) offer variable scaling of raster symbols. This means that the size of the raster map symbols can vary across the map or diagram, based on the quantitative value measured at each sample site. With this scheme, you can declare actual symbol sizes for as many z-value ranges as you wish, using a "Raster Symbol Range Table."
! You can store multiple Raster Symbol Range tables in your project database. If you assign detailed names they'll be easy to distinguish when you're selecting which to use. Raster Symbol Range tables can be accessed in the Project Manger program tab, under the Project Tables | Map/Model Tables grouping.
See Point Map Range Tables for similar scaling options for vector symbols.
These tables have a very simple format, containing 5 columns of information.
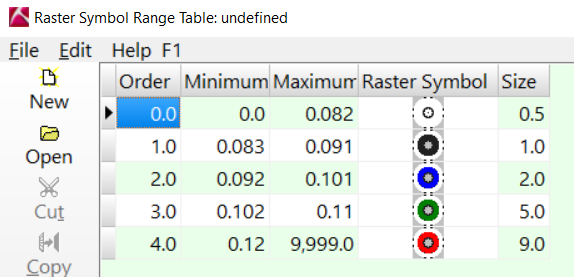
- Order: The values listed here are assigned automatically as you add rows to the table. You can edit these values to re-order the rows.
- Minimum and Maximum: These represent any real number values, and establish a measured value range. Any sample points containing z-values (in a column specified by the user), that fall within this declared range will be plotted on the map or diagram with the symbol, color, and size declared to the right.
- Raster Symbol: Choose a symbol and its color for the declared z-value range by double-clicking in the Raster Symbol column, selecting from one of the displayed symbols and choosing OK.
The symbols that are available are taken directly from the current Raster Symbol Table. See Raster Symbol Tables for more information.
- Size: In this column, for each z-value range, enter the size at which the shown symbol will be plotted in the point map. The size is declared in percent of map or diagram width.
In the above example, any samples in the dat sheet with Z-values (in this case, gold assay) ranging from 0 to 0.082 would be represented in the point map or other diagram with the open-circle symbol at 0.5 percent of the diagram width. Samples in the data sheet with Z-values ranging from 0.083 to 0.091 would be plotted with the round, black symbol at 1 percent of the diagram width. Samples with values between 0.092 and 0.101 would be represented with blue circles, and so on.

RockWare home page