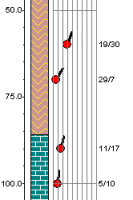
Use the Striplog Vectors check-box to plot your downhole vector measurements as tadpoles in your 2D striplogs. Insert a check in the Vectors Text check-box to plot the vector measurements (azimuth & inclination) at depth in a text column. The data is read from the Borehole Manager's Vectors data table.
The horizontal position of a tadpole indicates the absolute value of the inclination (0 on the left, 90 on the right) while the line/tail that extends from the symbol points in the direction of the azimuth (0=up, 90=right, 180=down, 270=left).
When you click on the Vectors or Vectors Text items in the layout window you’ll see the following settings in the pane to the right. Note that you can activate the tadpole and text columns independently.
Tadpole Options
Vector Text
- Column Layout
- Left Margin: Determines the space between the tadpole column and the item to its left, as a percent of the project output dimensions. The greater the value, the wider the space.
- Width: This setting establishes the width of the vector tadpole column, as a percent of the output dimensions. The greater the value, the wider the column.
- Column title: Click here to enter text to be displayed above the tadpole column. If no title is desired, you can leave this field blank.
- Font: This establishes the size for the column title as a percent of the output dimensions. A smaller size setting creates smaller text characters.
- Vertical Offset: Determines how far above the column the title will be plotted. If you expect to apply vertical exaggeration of 5x or more to your log or section, you might consider a value of 0.
- Perimeter: Insert a check here to border the tadpole column with a line style and color that you choose.
- Subdivisions: If activated, the program will display on the tadpole a series of vertical lines to function as a visual reference for the placement of the tadpole symbols.
- Intervals: This setting adjusts the number of divisions to be represented by the background lines. Since the horizontal placement of the symbol is determined by the dip angle (0 along the left, and 90 to the right), the default number of divisions is 9.
- Line Style: Choose the style and color for the background lines.
- Plotting Sequence: Choose Foreground for the lines to plot on top of the column, or Background for the lines to plot behind the column.
- Tadpoles: Click this tab to set the options for the tadpole symbols.
- Radius: Click to establish the symbol radius, as a percent of the output dimensions. The larger the value, the larger the symbol. The tadpole tail will be set to 2x the circle radius.
- Border Style: Choose a line style and color for the tadpole circle border.
- Tail Style: Choose a line style and color for the tadpole tail.
- Color
- Multi-Color: Choose this option to fill the tadpoles using the colors defined in the database.
- Monochrome (Fixed Color): Choose this option to fill the tadpoles with a fixed color. Click the color box to select the fill color.
- Column Layout
- Left Margin: Determines the space between the vector text column and the item to its left, as a percent of the project output dimensions. The greater the value, the wider the space.
- Width: This setting establishes the width of the text column, as a percent of the output dimensions. The greater the value, the wider the column. Note that you may have to adjust this if your font size is large.
! Text does not wrap within this column - it's designed for short labels.
- Column title: Click here to enter text to be displayed above the vector text column. If no title is desired, you can leave this field blank.
- Font: This establishes the size for the text title as a percent of the output dimensions. A smaller size setting creates smaller text characters.
- Vertical Offset: Determines how far above the column the title will be plotted. If you expect to apply vertical exaggeration of 5x or more to your log or section, you might consider a value of 0.
- Perimeter: Insert a check here to border the column with a line style and color that you choose.
- Interval Labeling
- Font: Establishes the size for the vector text labels as a percent of the output dimensions. A smaller size setting creates smaller text characters.
- Fill Interval: Check this if you want the background of the text column to be opaque. (This can be helpful when the logs overlie an interpolated panel, for example.) Click the color box to select the Fill Color.
- Azimuth Prefix: Click here to type in a prefix to plot before the azimuth measurements, such as "A=". For no prefix, you can leave this field blank.
- Inclination Prefix: Click here to type in a prefix to plot before the inclination (dip) measurements, such as "I=". For no prefix, you can leave this field blank.
- Azimuth/Inclination Separator: Click here to type in any characters you want to plot between the azimuth and dip labels. Default: "/".
 Back to 2D Striplog Options

RockWare home page