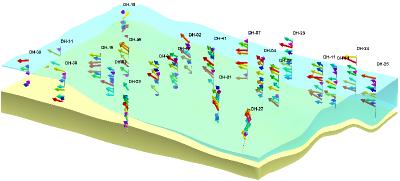
The Borehole Manager’s Vectors table is used to enter downhole directional data, such as groundwater flow directions, tiltmeter data, sonar data (current flow), which can be represented in logs as scalable arrows and can be modeled into cavern diagrams.
These instructions are for hand-entering the data; please see the links at the end of this topic for other options.
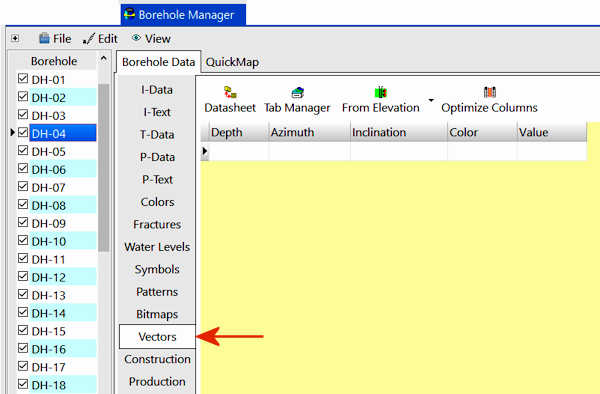
- Access the Borehole Manager program tab.
- Create a new well if necessary, or click on the existing well to be edited.
- Click on the Vectors tab for the well. If it is not visible, use the scroll buttons at the bottom of the tab listing to bring lower tabs into view.
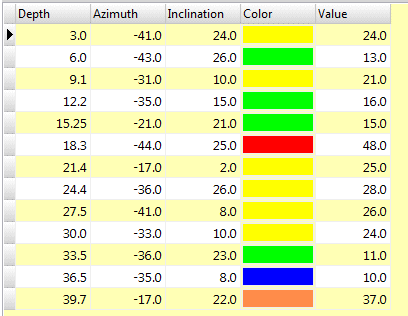
- Depth: Enter the measured depth to the vector origin.
! The depth units must be the same as the Vertical units you defined for the project (and which are displayed on the Location table). For example, if the elevation and TD for the hole are shown there in feet, then the depth listings here must be in feet as well.
! The depth values must be positive.
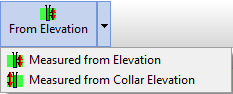
- From Elevation / From Collar Elevation: Use this button at the top of the table to define for this borehole which datum your depths were measured from. The designation will apply to all vector data, for all boreholes.
- Choose Measured from Elevation if the depths were measured from the ground elevation (entered as the "Z (Elevation)" field in the Collar Coordinates tab). This is the default setting.
- Choose Measured from Collar Elevation if the depths were measured from the collar elevation (entered as the "Collar Elevation" field in the Collar Coordinates tab).
-
- Azimuth: Enter the direction of the vector from the well, in azimuth degrees (from 0 to 360).
- Inclination: Enter the vector's angle in degrees from horizontal (0 = horizontal, -90 = straight down, and 90 = straight up).
- Color: Double-click in this cell and choose a color for the vector arrow that will be displayed in the logs and log sections.
- Magnitude: Enter the current flow rate or any other parameter that is used to define the "strength" of the vector. This can be used to scale the vector arrow in the logs. If creating cavern models, the magnitude is assumed to represent distance.
- Repeat this process if you have additional downhole measurements.
-
- The Striplogs menu for tools that display these vectors in logs and log sections.
- Importing Borehole Data for information about pulling in data from other sources (Excel, text, databases, etc.).
 Back to Data Introduction

RockWare home page