RockWorks | Borehole Operations | Striplogs | Google Earth Logs - Advanced
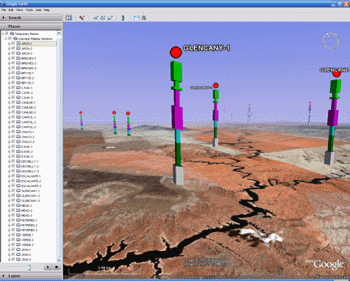
Use this program to display your stratigraphy data in Google Earth, plotted as vertical logs above the ground surface. Translation of your project database coordinates to longitude and latitude will occur automatically.
See also
Simple Google Earth Logs which offer fewer display options.
Feature Level: RockWorks Basic and higher
Menu Options
Step-by-Step Instructions
- Log Configuration
- Include:
- All Enabled Boreholes: Choose this option to create stratigraphy logs for all enabled boreholes in the database.
- Only the Currently Highlighted Borehole: Choose this option if you want to generate output for the active borehole only.
- Size
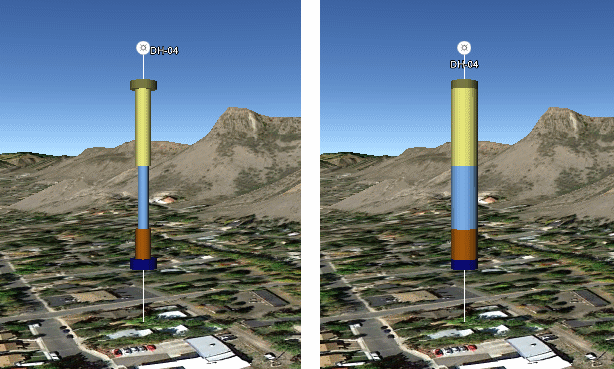
- Column Radius (meters): Use this setting to define how wide the logs will be, expressed in meters. The default setting is "2".
- Fixed (ignore Fill Percent): If unchecked, the stratigraphy intervals will plot based on the width declared in the Fill Percent column in the Stratigraphy Types table, which is a means of conveying erosion characteristics. If checked, then the logs will be of constant width.
-
- Plot Lines from Boreholes to Ground: Check this box if there should be a line extending from the base of the borehole to the ground surface.
- Color: Click on the color box to choose a color for these lines.
- Thickness: Enter the thickness (pixels) for the lines. A setting of "1" will create thin lines, and "3" will create thick lines.
- Plot Borehole Titles: Insert a check in this box to include borehole names at the top of the logs.
- Label Scale: This controls the size of the labels. Enter "1" for the default setting. If these are too large, enter "0.5" to scale the text smaller.
- Plot Borehole Symbols: Check this box to include borehole symbols at the top of the logs. The program will use the Raster Symbols defined in the Location table for each hole.
- Symbol Scale: This controls the size of the symbols. Enter "1" for the default setting. If these are too large, enter "0.5" to scale the symbols smaller.
- Title/Symbol Vertical Offset (Meters): Enter the vertical offset for the titles and symbols, above the top of the log, defined in meters. (Default = 10)
- Auto-Shift: Check this box to have Rockworks automatically shift the logs vertically upward, so that they will display above the ground surface. (Google Earth does not display objects below ground.)
- Vertical Offset (Meters): Use this setting to manually shift the logs upward in Google Earth, if the auto-shift is not activated, or to add an additional shift, if auto-shift is active.
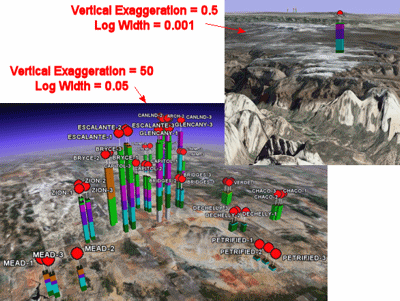
- Vertical Exaggeration: Use this setting to define how tall the logs will be in relation to the ground surface. The default setting is "1" - increase this value to make the logs appear taller, and decrease this value to make them appear shorter. See the images below for examples of the relationship between vertical exaggeration and column width.
- Group Name: Type in the name to assign to the output logs, which will be displayed in the Google Earth data tree.
- Output Options: Click on this tab to define the output file and display settings.
- Output File Name
- Automatic: Choose this option to have RockWorks assign the name automatically. It will use the name of the current program plus a numeric suffix, plus the ".KMZ" file name extension.
- Manual: Click this option to type in your own file name. The extension is ".KMZ".
- Display output within Google Earth: Check this box if you want to display the output at this time in Google Earth.
! Note that the actual program which will be used to display the KMZ file is determined by your Windows settings.
- Use Custom View: If unchecked, the starting viewpoint for the logs will be determined automatically. If checked you can set a custom view.
- Longitude, Latitude: Type in the longitude and latitude coordinates where the viewpoint will be.
- Heading: Type in the 0 to 360 degree bearing from the viewpoint to the logs.
- Tilt: Type in the angle downward from the viewpoint to the logs.
- Range: Enter the distance in meters from the viewpoint to the logs.
Follow these steps to create a Google Earth view of your stratigraphy logs.
- Access the RockWorks Borehole Manager program tab.
- Be sure the boreholes whose stratigraphy data are to be displayed in Google Earth logs are enabled (shown with check-marks in the Borehole Manager list).
- Select the Striplogs | Google Earth Logs - Advanced option from the Borehole Operations menu.
- Establish the program settings, as described above.
- Click the Continue button to proceed.
The program will read the stratigraphy data for the enabled boreholes and create a KML file with the log data. It will create a KMZ (zip) file containing the KML file. The Google Earth KML and KMZ file names will be assigned as you specified.
The logs will be displayed in Google Earth, if requested.
 Back to StripLogs Menu Summary
"Google Earth" is a trademark of Google Inc.

RockWare home page