Use the Striplog Bitmaps check-box to plot downhole raster images in vertical 2D logs. These images can represent raster elogs, digital core photographs, etc. The image depths and names are read from the RockWorks Borehole Manager's Bitmaps data table. When you click on the Bitmaps item in the layout window you’ll see the following settings in the pane to the right.
- Column Layout
- Left Margin: Determines the space between the bitmap column and the item to its left, as a percent of the project output dimensions. The greater the value, the wider the space. Default = 0.1.
- Width: This setting establishes the width of the bitmap column, as a percent of the output dimensions. The greater the value, the wider the column. Default = 1.
- Column title: Click here to enter text to be displayed above the bitmap column. If no title is desired, you can leave this field blank.
- Font: This establishes the size for the title as a percent of the output dimensions. A smaller size setting creates smaller text characters. Select also the color and angle.
- Vertical Offset: Determines how far above the column the title will be plotted. If you expect to apply vertical exaggeration of 5x or more to your log or section, you might consider a value of 0.
- Perimeter: Insert a check here to border the column with a line style and color that you choose.
- Display Options
- Type of Bitmap To Display:
- All Types: Choose this option if all of the raster images currently listed for the boreholes are to be plotted in the Bitmap column. If you have defined multiple Bitmap Types, and want to plot all of them, just be sure that they exist at different depth ranges.
- Specific: Choose this option if you want to plot a selected Bitmap Type only. Click to the right to choose the bitmap category to be displayed at this time. This list is pulled from the Bitmap Types table. You can choose the name from the drop-down list, or you can click the small button to view the Bitmap Types table and select the category there.
-
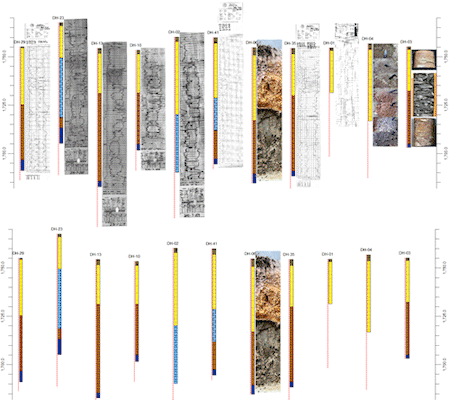
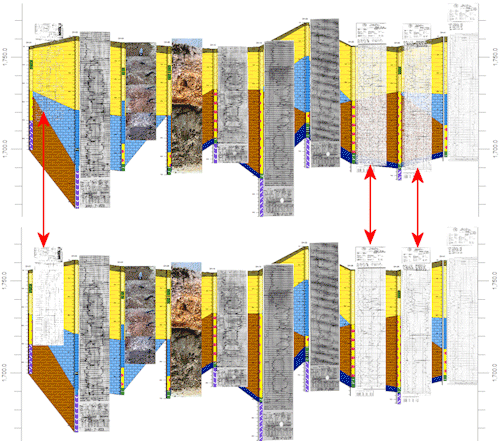
In the example shown here, the upper cross section was generated with All Types selected, and the logs display scanned elogs, core photos, outcrop photos - all images in the database for those boreholes. By contrast, the lower section was generated with the Outcrop Photos only.
- Aspect Ratio: Use these settings to determine if the original bitmap aspect (width:height ratio) will be preserved or if it will be horizontally stretched or reduced to fill the designated column.
- Preserve: Choose this option to maintain the original image aspect ratio so that the image is not distorted. This is especially useful when viewing poor-quality raster logs.
- Limit to Column Width: Use this setting to define how the width of the column is to be handled, given the aspect ratio setting.
If this is not checked, then the vertical scale of the image takes precedence. The image will extend within the defined top and base depths, and, if necessary, will extend horizontally beyond the extent of the column (shown below as a red outline) to maintain the aspect ratio. You can refer to the log on the left side of the image below.
If this is checked, then the horizontal scale of the image takes precedence. The image will extend within the defined column width and, if necessary, will be shortened or lengthened to maintain the aspect ratio. See the middle log in the example below.
-
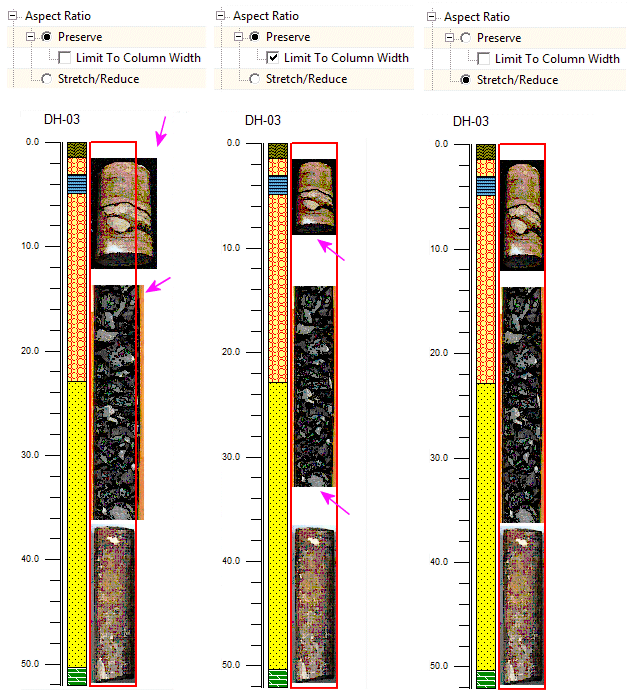
- Stretch/Reduce: Choose this option if you want the image to be stretched or reduced to fit the designated log column width, regardless of the original image aspect ratio. This produces a more uniform appearance within cross-sections but the images may be distorted. See the log on the right in the above example.
- Opacity/Transparency: Use these settings to either establish opacity/transparency for all of the images, or to select a specific color to be rendered transparent.
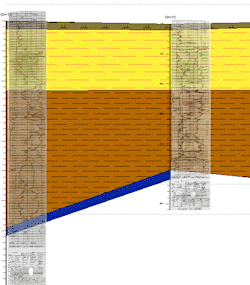
- Set Opacity: Click in this radio button to define the opacity for the entirety of the image(s), and click to type in the opacity value. A value of "100" means fully opaque, and "0" means fully transparent. In the following example, the transparency was set to 60. This can be very useful when you want to see what's plotted below the striplogs on sections that include background information (e.g. correlations).
-
- Transparent: Choose this option if you want to define a specific color to be rendered transparent for all of the bitmaps in all of the logs.
- Color: Click to the right to define that color. For example, if your images all have white borders, you could set the Transparent Color to white to make those borders disappear entirely.
The example below shows a cross-section in which white has been selected as the transparent background color. The lower section illustrates the same logs with no transparent color enabled, and the logs at 100% opacity. Notice the difference between the white-background logs indicated by the red arrows.
 Back to 2D Striplog Options

RockWare home page