The Borehole Manager’s Bitmaps table is used to enter one or more depth intervals for each borehole and the name of the image to be plotted between these depths, in individual logs and in log cross sections. These can represent raster logs, downhole images, core samples, and more. Raster images are limited to display in vertical logs only in 2D logs and sections (no warping of the image will occur); in 3D, images can be displayed in vertical and inclined holes (not deviated wells).
You can define Bitmap Types to organize and categorize your raster images.
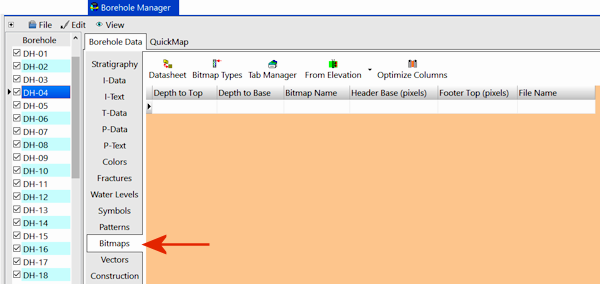
- Access the Borehole Manager program tab.
- Create a new well if necessary, or click on the existing well to be edited.
- Click on the Bitmaps tab for the well. If it is not visible, use the scroll buttons at the bottom of the tab listing to bring lower tabs into view.
RockWorks includes a window where you can preview the raster image and interactively click points on the image to define the fields listed below. Here's how:
- Double-click in the File Name field.
- Browse for the name of the first image to be listed for this well and click the Open button to open it.
! This file must reside in the current project folder.
- You will see the image displayed in a preview window. Now you can depth register the image. Note that you can use the scroll bars to view portions of the image outside the current window, and the Image Size prompt at the bottom to zoom in and out of the image display.
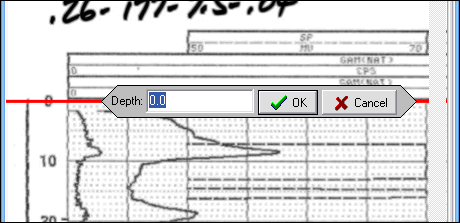
- Click on any point near the top of the log. This is typically the very top of the background grid, but it can actually be any point within the log where the depth is known.
- Once the point has been selected, a red horizontal line will be drawn at the designated depth and you will be prompted to enter the depth at that location. Type in the depth and click OK.
! The depth units you enter here must be the same as the Vertical units you defined for the project (and which are displayed on the Location table). For example, if the elevation and TD for the hole are shown there in feet, then the depth listings here must be in feet as well.
! The depth values must be positive.
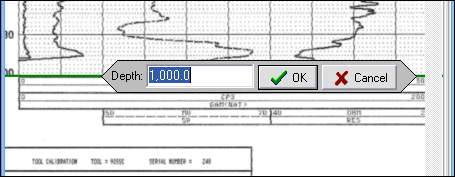
- Move the cursor to any point near the base of the log. This is typically the very base of the background grid, but it can actually be any point within the log where the depth is known.
- Once the lower point has been selected, a green horizontal line will be drawn at the designated depth and the user will be prompted to enter the depth at that location. Enter the depth and click OK.
The Raster Log Calibrator screen will disappear and the appropriate information be computed and displayed within the Bitmaps tab. This eliminates the need to load the raster image into another program to determine the header and footer offsets.
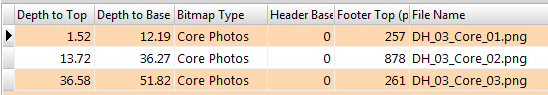
- Depth to Top: This field is populated by the depth registration process, above, and specifies the depth where image's Header Base Pixel is to be placed.
! The depth units must be the same as the Vertical units you defined for the project (and which are displayed on the Location table). For example, if the elevation and TD for the hole are shown there in feet, then the depth listings here must be in feet as well.
! The depth values must be positive.
- Depth to Base: This field is populated by the depth registration process and defines depth where the Footer Top Pixel will be placed.
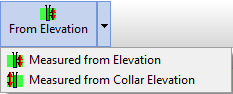
- From Elevation / From Collar Elevation: Use this button at the top of the table to define for this borehole which datum your depths were measured from. The designation will apply to all of raster images, for all boreholes.
- Choose Measured from Elevation if the depths were measured from the ground elevation (entered as the "Z (Elevation)" field in the Collar Coordinates tab). This is the default setting.
- Choose Measured from Collar Elevation if the depths were measured from the collar elevation (entered as the "Collar Elevation" field in the Collar Coordinates tab).
-
- Bitmap Type: This field is used to define the category for the raster image - scanned log, core photo, etc. This especially useful if you wish to store multiple images for each borehole. Select the Bitmap Type from the drop-down list, or you can double-click in this cell to access the Bitmap Types table, where the categories are defined. Later, when you set up your striplog layout, you'll be able to select which of the bitmap types you want to plot.
- Header Base: This field is populated by the depth-registration process and represents the pixel (picture element) row to be plotted at the Depth to Top shown to the left. If your bitmap includes extra data at the top of the diagram (e.g. a log header containing textual information about the borehole such as the drilling contractor, column titles, etc), the program will automatically adjust the diagram position by shifting the log such that the proper portion of the bitmap aligns with the depth specified by the Depth to Top setting. Bitmap rows are counted from the top down. For example, the top row is considered to be row zero, while the y-coordinate at the base of the log might be 2000.
- Footer Top: This field is populated by the depth-registration process and represents the pixel row to be plotted at the Depth to Base defined to the left. If your bitmap includes extra data at the base of the diagram, the program will automatically adjust the diagram position by shifting the log such that the proper portion of the bitmap aligns with the depth specified by the Depth to Base setting.
- File Name: Double-click here to browse for the name of the image file to be displayed in the log. There is a small preview for your reference. RockWorks can read a variety of graphic formats (BMP, JPG, TIF, WMF, EMF, PCX, PNG, TGA, click here for details). Once you select the file name, the program will walk you through the depth registration process, described above.
! The image must reside in the current Project Folder.
- Note: If the original bitmap looks good, it will probably look good within sections and 3D diagrams provided that it is stretched correctly and the lighting is set to the right angle. If the original bitmap looks bad, it will only look worse within a log diagram.
- Repeat this process if you have additional downhole images.
-
- The Striplogs menu for tools that display these images in logs and log sections.
- Importing Borehole Data for information about pulling in data from other sources (Excel, text, databases, etc.).
 Back to Data Introduction

RockWare home page