RockWorks | Borehole Operations | Lithology | Lithology/Stratigraphy by XY
This program is used to read an existing lithology model (.RwMod file) and summarize the relative percentages of the lithology types for each X,Y node location. The output summary will be listed in a text file.
! You can also use this program to summarize the formations in a solid model which represents stratigraphic units.
See also
Multivariate Map to display lithology materials by location in a pie chart or starburst map.
Feature Level: RockWorks Basic and higher
Menu Options
Step-by-Step Summary
- Data Columns
- G-Value: Choose the column in the datasheet where the G-Values for the lithology types (or stratigraphy types) to be analyzed are listed.
- Input/Output
- RockWorks Lithology Model (RwMod) File (Input): Click to the right to browse for the name of the existing solid model file (.RwMod) to be read and summarized.
- ASCII (Text) File (Output): Click to the right to type in a name for the text file which will contain the summary data.
- Formatting
- Include Header: Check this box if the first line in the output file should contain labels for the column content (e.g. "X", "Y", a column for each G value, "Misc." and "Total"). Remove the check-mark if no header line is to be included.
- Column Delimiter: Click the button to the right to choose the character(s) to serve as the column separators in the output file.
- Decimals: Enter the number of decimal places for the percentage calculations.
- Display in Default Editor: Check this item to have RockWorks load the output report into the text editor program defined as default in Windows (typically Windows Notepad). Leave this unchecked if you don't want to view the output file at this time.
- Access the RockWorks Datasheet program tab.
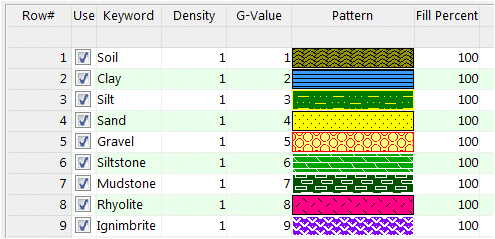
- List the G values for the lithology types to be analyzed in separate rows in a single column in the datasheet. An easy way to do this is to open your Lithology Types table and choose File | Export to Datasheet. Here's an example of how this might look; note the G-Value column to the left of the patterns:
- Select the Borehole Operations | Lithology | Lithology/Stratigraphy by XY menu option.
- Enter the requested program settings, described above.
- Click the Continue button to proceed.
The program will read the indicated lithology (or stratigraphy) solid model file and compute the percentage of each lithology (or stratigraphy) type in each XY column of nodes in the model. The report will be saved under the requested file name. It will be loaded into your default editor if requested.
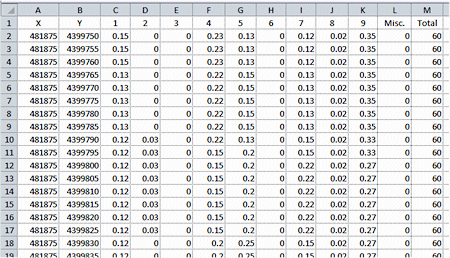
Here's an example of a report copied from the text editor into Excel. The first two columns contain the X and Y coordinate locations for the column of node values. The next columns list the G-Values you requested in the datasheet (example above). The Misc column will list the null values, and the Total column the number of nodes.
 Back to Solid Menu Summary

RockWare home page