RockWorks | Borehole Manager | P-Data | Analyze | Resample
Use this program to read the values in a P-Data column and resample them to finer or coarser depth increments, recording the resampled values in a user-selected P-Data column. Any existing data in the output column will be overwritten.
Feature Level: RockWorks Standard and higher
Menu Options
Step-by-Step Summary
- Input/Output
- Input (P-Data) Track: Click here to select the existing P-Data column that contains the measurements to be resampled.
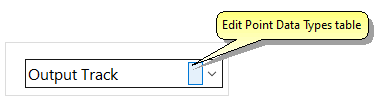
- Output (P-Data) Track: Click here to select the P-Data track where the resampled values are to be recorded.
! Any existing data listed there will be overwritten.
! If you need to add a new track to the P-Data table, click the rectangular button to access the P-Data Types Table.
- Resampling Options
- Sample Interval: Enter the depth interval at which the points are to be resampled. For example, if you have Gamma Ray measurements imported from a LAS file and listed at 0.1 foot increments, you could enter "1" here to resample the data at a coarser 1-foot interval for processing and modeling.
- Filters: These options are useful when the original data has not been sampled at regular intervals. Specifically, the "spline" algorithm that is used to interpolate the new, regularly-spaced data may become overly creative within the regions where there isn't any data in order to produce the least amount of curvature. These filters allow the user to eliminate this phenomena (if it occurs). The filters may also be used to simply remove "outliers". The following examples illustrate some of the filtering capabilities:
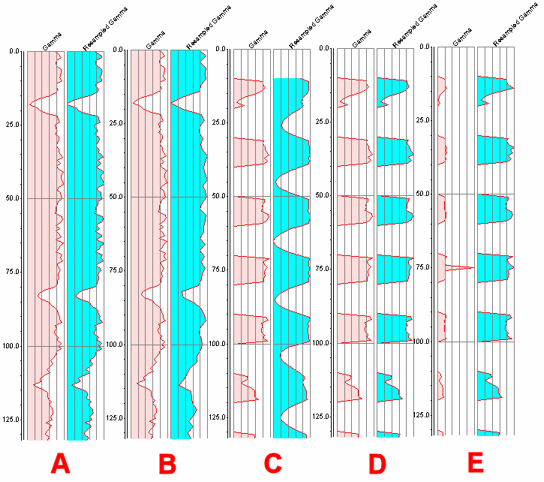
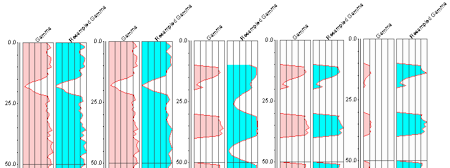
- A) In this example, the original data was sampled at 1' intervals and the resampling was performed at 0.5' intervals thereby producing an implicit smoothing without loss of accuracy.
- (B) In this example, the original data was sampled at 1' intervals and the resampling was performed at 2' intervals thereby producing a implicit averaging. This operation diminishes the accuracy contained within the original data.
- (C) In this example, the original data was sampled at 1' intervals with 10' gaps between 10' sampling intervals. The resampling was performed at 1' intervals. Notice how the splining (curve-fitting algorithm) attempts to minimize the curvature between the blank intervals. Unfortunately, these curves project the data to a level below zero. Specifically, the curve on the left ranges between zero and 250, while the curve on the right ranges between -658 and 250.
- (D) In this example, the original data is identical to example C, however the resampling used a filter (high-pass/low-stop) that truncated values less than zero to a value of zero.
- (E) In this example, the original data contains an "outlier" at 75' depth that "compresses" the other data. The curve on the right truncates the outlier (using a high-stop/low-pass filter) thereby displaying the full range of data.
- Apply to
- All Boreholes (Enabled and Disabled): Choose this if the selected track for all boreholes is to be resampled.
- Only Enabled Holes: Choose this option if the selected track is to be resampled only in boreholes which are currently enabled.
- Currently Highlighted Borehole (Single Borehole): Choose this if the program is to perform the computations for a single borehole. The currently-selected borehole is displayed here, click another from the list to change the active hole.
- Access the RockWorks Borehole Manager program tab.
- Create, if necessary, a column in the P-Data table where the resampled computations will be stored. If there is any existing data in this column, it will be overwritten. See Defining the P-Data Columns for more information.
- Select the Borehole Operations | P-Data | Resample menu option.
- Enter the requested program settings, described above.
- Click the Continue button to proceed.
RockWorks will read the contents of the input track and perform the requested computations, recording the output in the indicated P-Data column.
 Back to P-Data Menu Summary

RockWare home page