Use this program to read a P-Data column containing Gamma counts per second (or milli- or micro-second) and translate them to Uranium Grade values, which will be recorded in the I-Data or P-Data table. The translation can be for a single well or all enabled boreholes.
Feature Level: RockWorks Standard and higher
Menu Options
Step-by-Step Summary
The K-Factor can be defined with an unlimited number of decimal places.
RockWorks will read the contents of the input Gamma (P-Data) Track and perform the following computations, recording the output in the indicated I-Data or P-Data column.
For each depth increment (as defined by the original sampling interval):
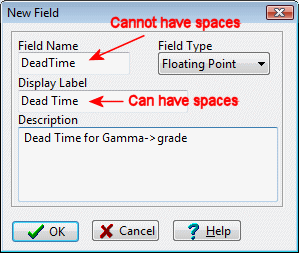
If the dead-time input units are set to micro or milli-seconds the dead-time is converted to seconds.
The "deadtime_adjusted_counts" are computed by the following equation:
deadtime_adjusted_counts = raw_counts / abs ( 1 - ( raw_counts * deadtime ) )
Finally, the uranium grade is computed by the next equation (a variation of the 2KN equation):
uranium_grade = deadtime_adjusted_counts * k_factor * water_factor * casing_factor * ( 1 / interval_thickness )
Next, the data is resampled (via a spline algorithm) at intervals equal to the specified "Sample Interval". If not for this resampling procedure, the interval_thickness value within the preceding equation would be invalid (i.e. the interval thickness would be greater than the distance between the original points).
This approach assumes that the original raw-count data was sampled at regular intervals (i.e. via a wireline tool that sampled at a constant rate).
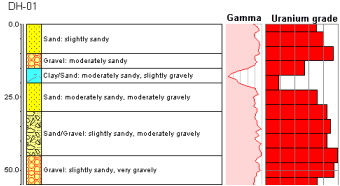
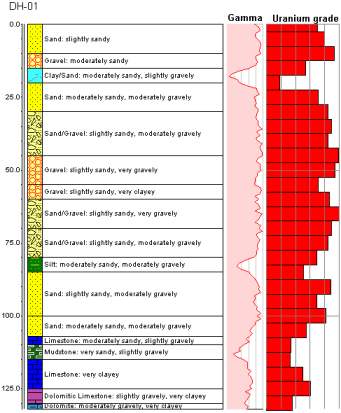
You can now display the Uranium grade as an I-Data bargraph or a P-Data curve on striplogs, and use the I-Data or P-Data tools to interpolate solid models of the grade data.
![]() Back to P-Data Menu Summary
Back to P-Data Menu Summary
![]()