Use the Google Earth | Float (Advanced) option in the Project Settings | Dimensions pane to display a 3D grid of your Grid & Block Model Dimensions in Google Earth. This program requires that you have Google Earth installed separately on your computer. It is not included with the RockWorks installation.
This program:
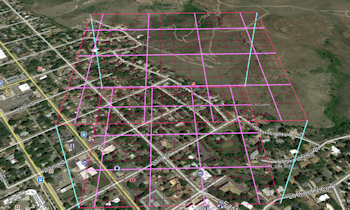
- Reads the current Output Dimensions coordinates, coordinate system, and units.
- Creates a KML output file including the project perimeter, fill, grid lines, and labels as requested.
- Creates a KMZ (zip) output file, containing the KML file.
- Loads the KMZ file in Google Earth.
See also: Project Dimensions
Menu Options
Step-by-Step Summary
- Elevations: Use these settings to define the elevations for the top and base of the 3D dimension grid. (Since you cannot view underground in Google Earth, we have to offset the 3D Dimensions above ground, so your true project elevations below ground surface cannot be used.)
-
- Float Elevation (Meters): Type in the elevation in meters above ground surface for the top of the 3D Dimensions grid.
- Base Elevation (Meters): Type in the elevation in meters above ground surface for the base of the 3D Dimensions grid.
- Perimeter Properties: Click on this tab to define how the dimensions map will appear.
-
- Fill Project Area With Color: Insert a check here to fill the project perimeter with a solid color.
-
- Fill Color: Click on the color box to the right to choose the fill color.
- Extend Fill Area Outside Project Area: Insert a check here if the fill should extend beyond the project perimeter.
-
- East/West Margin: Type in a percent of the East-West dimensions to extend the polygon fill.
- North/South Margin: Type in a percent of the North-South dimensions to extend the polygon fill.
- Perimeter: Insert a check here to include a perimeter line around the project boundary.
-
- Color: Click the color box to define the color for the perimeter line.
- Thickness: Type in the desired pixel thickness for the perimeter polyline. ("1" = thin, "3" = relatively thick.)
- Grid: Check this box to include grid lines through the middle of the project area.
-
- Major Subdivisions:
-
- Color: Click the color box to define the color for the major grid lines.
- Thickness: Type in the desired pixel thickness for the major grid lines. ("1" = thin, "3" = relatively thick.)
- Minor Subdivisions:
-
- Color: Click the color box to define the color for the minor grid lines.
- Thickness: Type in the desired pixel thickness for the minor grid lines. ("1" = thin, "3" = relatively thick.)
- Tick Marks
-
- Exterior (Outside Perimeter): Check this box to include small ticks outside the perimeter; the labels (if activated) will plot next to these.
- Interior (Inside Perimeter): Check this box to include small ticks inside the perimeter; the labels (if activated) will plot next to these.
- Perimeter Labels: Check this box to include coordinate labels in the output graphic.
-
- Label Height: Choose Automatic for the program to figure this out automatically. Choose Manual to define the label height in meters.
- Font Color: Click the color box to choose a color for the labels.
- XY Decimal Places: Type in the number of decimal places to be included in the labels.
- Decimation Factor: This setting will define the label frequency. At a setting of "1", then every major grid line will include a label. At a setting of "2", then every other major grid line will include a label.
- Subdivisions & Annotation Intervals: Use these settings to determine how the subdivisions will be determined.
-
- Automatic: RockWorks will determine automatically the major and minor intervals. (Labels will accompany the major lines, at the Decimation Factor defined above.)
- Manual: Enter your preferred major and minor intervals.
-
- Major Subdivision Interval: Type in the interval at which you want major grid lines drawn, in meters.
- Minor Subdivision Interval: Type in the interval at which you want the minor grid lines to be drawn, in meters.
- Plot Vertical Corner Lines: Check this box to include vertical lines at the cornesr of the 3D Dimensions grid, extending between the top and base grids.
-
- Color: Click the color box to choose a color for the vertical lines.
- Thickness: Type in the desired pixel thickness for the vertical lines. ("1" = thin, "3" = relatively thick.)
- Plot elevation labels along vertical lines: Check this box if you want the lines to include elevation labels.
- Major Subdivision Spacing: Type in the desired spacing of the labels, in meters.
- Minor Subdivision Spacing: Type in the desired spacing of the tick marks along the lines, in meters.
- Group Name: Click on this tab to type in a name for the group heading for the 3D Dimensions grid, which will be displayed in Google Earth.
- Output Options: Click on this tab to define the output file and display settings.
-
- Output File Name
-
- Automatic: Click this option to have RockWorks assign a name to the KMZ file which will be generated for display in Google Earth.
- Manual: Click this option to type in your own file name. The extension is ".KMZ".
- Display output within Google Earth: Check this box if you want to display the output at this time in Google Earth.
-
- Use Custom View: If unchecked, the starting viewpoint for the map will be determined automatically. If checked you can set a custom view.
-
- Longitude, Latitude: Type in the longitude and latitude coordinates where the viewpoint will be.
- Heading: Type in the 0 to 360 degree bearing from the viewpoint to the map.
- Tilt: Type in the angle downward from the viewpoint to the map.
- Range: Enter the distance in meters from the viewpoint to the map.
- Expand the Project Settings pane if necessary.
- Click on the Dimensions tab.
- Establish your Grid & Model Dimensions as necessary, by typing them into the prompts, scanning your borehole data, or scanning your datasheet coordinates.
- Click on the Show in Google Earth button, to the right of the Dimensions grid, and choose Float (Advanced) from the pop-up menu.
- Enter the menu options as described above.
- Click the Continue button to proceed.
The program will create a KML file representing your Output Dimensions perimeter, fill, grid lines, and labels as requested. It will create a KMZ (zip) file containing the KML file.
The resulting map will be displayed in Google Earth, if requested.
 Back to Project Dimensions
"Google" is a trademark of Google Inc.

RockWare home page