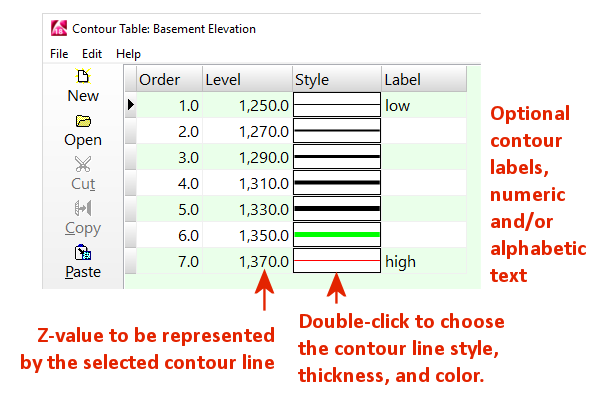
A "Contour Table" is used to define a listing of Z-values and their corresponding line styles and (optionally) contour labels, to be used by the program when building 2D line contour maps for which you have requested "Custom" intervals.
! You can store multiple Contour tables in your project database. You can assign detailed names so that they'll be easy to distinguish when you're selecting which to use. Contour tables can be accessed in the Project Manger program tab, under the Project Tables | Map/Model Tables grouping.
! If you need to verify the Z value range of your grid model, use the Grid | Statistics | Report command to view a grid summary.
![]()