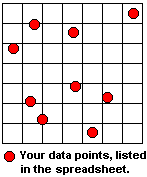
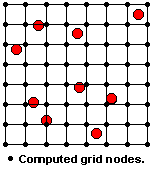
You might picture a grid model (".rwGrd" file) as a grid of imaginary lines that overlays your source data points. In the process of gridding, the program assigns a value to the grid line intersections, called grid nodes.
Each node has an X,Y location, and a "Z" value that the program interpolates. The Z value can represent elevations, thickness calculations, chemical values, occurrences - basically any real number.
The dimensions of your grid models are generally established in your Grid & Model Dimensions settings, though they can also be defined manually. The dimensions of a grid model are illustrated in the diagram shown below.
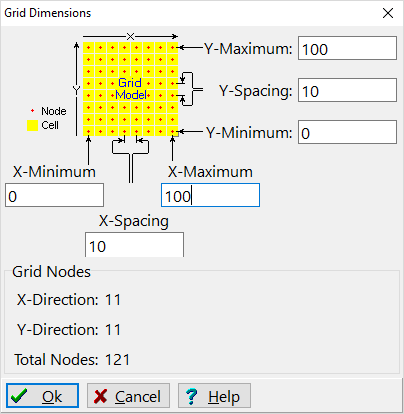
These items define the dimensions of a grid model:
When RockWorks draws a contour map of the data stored in a grid model, it draws the map to the X and Y Minimum and Maximum extents of the model nodes. In the above example, the map contours would be drawn from a coordinate of 0 to 100 along both the X and Y axes, as shown in red below. This means the area of the map itself would be 100 x 100 or 10,000 square feet.
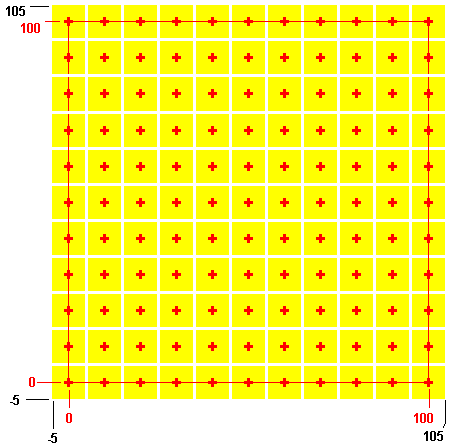
However, when RockWorks computes the area of the grid model itself, the results are going to be slightly different. The program computes area by computing the area of a grid cell, and then multiplying that by the number of cells in the model. Since only one node can exist in a cell (for volume purposes), creating a cell by connecting 4 nodes won't work. Instead, RockWorks arranges the grid cells with the nodes in the center.
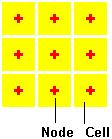
So, when grid area is computed it will be larger by one grid-node-spacing along both axes. In the example above, the grid area would extend from -5 to 105 along the X and Y axes, and the area would total 12,100 square feet.
![]()