RockWorks | Graphics | Animate | Google Earth Sea-Levels
Use this program to:
- Read a user-created raster image, and load start/end elevations, start/end dates, locations, and elevations from the input menu.
- Create an animation of the image floating at incremental elevations through time in Google Earth. This animation can be played within Google Earth.
See also
Floating Image Maps using Midpoints
Floating Image Maps using 2 Corner Points
Floating Image Maps - Time-Based Animations
Feature Level: RockWorks Basic and higher
 Watch Video
Menu Options
Step-by-Step Summary
- Options
- Area of Interest: These settings define the edges of the sea level image that you'll be "floating" in Google Earth. RockWorks will stretch the image to fit between the coordinates you define.
- Longitude:
- Minimum (Western Border): Type in the decimal longitude for the western edge of the sea level image. Western longitudes must be entered as negative values.
- Maximum (Eastern Border): Type in the decimal longitude for the eastern edge of the sea level image.
- Latitude:
- Minimum (Southern Border): Type in the decimal latitude for the southern edge of the image. Southern latitudes must be entered as negative values.
- Maximum (Northern Border): Type in the decimal latitude for the northern edge of the image.
- Elevations: These define the elevations at which the sea level image will be floated in the animation.
- Starting Elevation (Meters): Type in the elevation at which the image is to float at the beginning of the animation. For sea level, enter 0.
- Ending Elevation (Meters): Type in the elevation at which the image is to float at the end of the animation. For example, to represent a plane at sea level 30 meters above present sea level, you would enter 30.
- Elevation Increments (Meters): Type in the meter increments at which the sea level image is to be floated. This will determine the number of "steps" in the animation. For example, if the starting elevation is 0, the ending elevation is 30, and the increment is 0.5, there will be 61 steps including the endpoints.
! Note: The starting elevation can be above the ending elevation to show a decreasing level in the animation, such as a reservoir draining. The increments are still entered as positive values.
- Dates / Times: These define starting and stopping dates for the animation. These can be specific or arbitrary dates.
- Starting Date: Click the "v" button to the right to select a date from the pop-up calendar. Or, click to select any of the fields and type in the desired day, month, and year for the animation starting date. (Note that RockWorks will assume you are entering the dates in a format consistent with the date format established in the Windows system settings on your computer.)
- Ending Date: In the same manner, choose the ending date for the animation.
- Color or Image Used to Represent Sea Level:
- Ocean Blue: Choose this option to use a solid blue color to represent the sea surface.
- Image: Choose this option to browse for a specific image file to be floated in Google Earth to represent the sea surface. This must be an image that already exists on your computer. This program supports .BMP, .JPG, .PNG, .GIF, .TGA, and .TIF images.
The image will be stretched to fit between the longitude and latitude coordinates you defined above.
- Image Opacity: Type in or use the up/down arrows to establish an integer between 0 and 100, where "100" represents fully opaque and "0" represents fully transparent (and invisible).
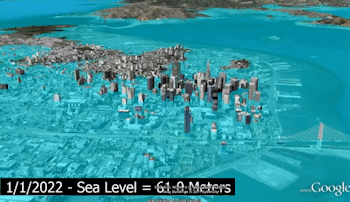
- Annotation: Check this item to add labels to the Google Earth display noting the dates and levels as the animation runs (see the characters in the lower-left corner of the image at the top of this page).
- Starting Date: Check this box to include the starting date for each increment in the label.
- Ending Date: Check this box to include the ending date for each increment.
- Sea Level: Check this box to include the sea level elevation for each increment.
- Date/Time Format: Choose whether to display the date only, or date and time.
- Font Size (Pixels): Type in or use the up/down arrows to establish the size for the labels, in pixels. A setting of "30" creates fairly large labels; "10" are fairly small. These labels do not resize as you zoom in and out of the Google Earth display.
- Background Color: Click the color sample to select a background color for the characters.
- Foreground Color: Click the color sample to select a fill color for the characters.
- Group Name: Click on this tab to type in the name for the animation, as displayed in Google Earth.
- Output Options: Click on this tab to define the output file and display settings.
- Output File Name
- Automatic: Choose this option to have RockWorks assign the name automatically. It will use the name of the current program plus a numeric suffix, plus the ".KMZ" file name extension.
- Manual: Click this option to type in your own file name. The extension is ".KMZ".
- Display output within Google Earth: Check this box if you want to display the output at this time in Google Earth.
! Note that the actual program which will be used to display the KMZ file is determined by your Windows settings.
- Use Custom View: If unchecked, the starting viewpoint for the animation will be determined automatically. If checked you can set a custom view.
-
- Longitude, Latitude: Type in the longitude and latitude coordinates where the custom viewpoint will be.
- Heading: Type in the 0 to 360 degree bearing from the viewpoint to the animation.
- Tilt: Type in the angle downward from the viewpoint to the animation.
- Range: Enter the distance in meters from the viewpoint to the animation.
- Access the RockWorks Datasheet program tab.
- If you want to use a specific graphic image to represent the sea level at different elevations in the animation, be sure you have that image handy.
- Select the RockWorks | Graphics | Animate | Google Earth Sea-Levels menu option.
- Enter the program settings as described above.
- Click the Continue button to proceed.
The program will create a KML file listing the animation and referencing the raster image at the defined location and starting elevation. It will create a KMZ (zip) file containing the KML file and the image file. The Google Earth KML and KMZ file names will be assigned as you specified.
The resulting animation will be displayed in Google Earth, if requested. You'll see the Google Earth Time-Slider at the top of the display - use these controls to run the animation.
 Back to Graphics Animate Menu Summary
"Google" is a trademark of Google Inc.

RockWare home page