RockWorks | Utilities | Imagery |
Vertical Images -> X/Y/Z/Color
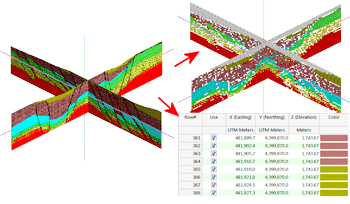
Use this program to create a table of X/Y/Z/Color points based on images listed within the Utilities datasheet. These extracted points can be used for subsequent modeling.
The input data is the same as that required for the Vertical Images -> 3D Panels option.
See:
Menu Options
Step-by-Step Summary
Menu Options
- Specify the datasheet Input Columns in the left pane of the window.
- File Name: Select the column that lists the name(s) of the raster image(s) to be sampled.
Tip: use the File | Import | Create File List program to quickly create a list of specified file names.
- Layer Name: Select the column in which the layer names are listed. For this program, the layers are optional.
- X Lower-Left, Y Lower-Left, Z Lower-Left: Select the three columns in the datasheet that list the Easting, Northing, and elevation coordinates for the lower-left corner of the bitmap.
These can be defined in your project coordinates or other coordinate system. See Defining your Datasheet Coordinates for more information.
- X Upper-right, Y Upper-right, Z Upper-right: Select the three columns that list the Easting, Northing, and elevation coordinates for the upper-right corner of the bitmap.
- Pixel Sampling Intervals: Converting every pixel to a control point will typically result in a control point array that is huge thereby creating memory and/or execution speed problems. The Point Sampling Intervals allow the user to create a reasonably-sized data set.
- X (Horizontal) Sampling Frequency: This setting determines how often, on a horizontal/column basis, the image pixels will be sampled. For example, a setting of 1 will sample every pixel whereas a setting of 5 will cause the program to sample every fifth pixel.
- Y (Vertical) Sampling Frequency: This setting determines how often, on a vertical/row basis, the image pixels will be sampled. For example, a setting of 1 will sample every row of pixels whereas a setting of 5 will cause the program to sample every fifth row.
- Ignore Specified Color: It may be desirable that certain colors be ignored when converting image pixels to control points. For example, the black borders and patterns within the example at the top of this page will create undesirable effects within the final model. This filter allows the user to ignore any pixels that fall within a specified color range.
- Color: This is the color that will be ignored.
- Tolerance: In the example above, black is the color that is to be ignored, but there may be pixels that are nearly black (e.g. dark gray). The tolerance setting provides a means for expanding the range of the filter to include colors that are similar to the desired color. Tolerance is defined as a percent, whereby "100" would include all colors, and "0" would include the selected color only.
- Decimal Places:
- X/Y Coordinates: Click here to define the number of decimal places to show within the X and Y coordinates in the output report.
- Z Coordinates: Click here to define the number of decimal places to show within the Z coordinates in the output report.
- Create Diagram: If you want to create a diagram depicting the X/Y/Z/Color data as color-coded spheres (see the example at the top of the page), check this box.
- Sphere Radius: The radii of the color spheres are specified as a percentage of the project dimensions.
- Reference Cage: Insert a check here to include reference labels or lines in the output 3D image. (More.)
Step-by-Step Summary
- Access the RockWorks Utilities program tab.
- Open a data file that contains a listing of bitmap image names and their lower-left and upper-right real-world coordinates. These could be, for example, scanned images of 2D seismic or ground penetrating radar sections.
- Select the Imagery | Vertical Images -> X/Y/Z/Colors menu option.
- Enter the menu settings as described above.
- Click the Process button to continue.
The program will read the indicated bitmap image(s), and assign them the indicated coordinates in 3D space. It will then sample the image pixels at the requested intervals, and record the XYZ coordinate for the pixel as well as the color.
The completed listing of X, Y, Z points with colors will be recorded to the Utilities datasheet.
If you requested a display of these points, they will be displayed in a RockPlot3D tab in the Options window.
- You can adjust any of the menu settings along the left (such as color or sampling interval) and click the Process button to regenerate listing and 3D image.
! Each time you click the Process button, the existing data and display will be replaced.
- View / save / manipulate / print / export the image in the RockPlot3D window.
- For the output data, now listed in the Utilities datasheet, you can use the Solid menu to interpolate a solid color model. (Be sure to access the Solid Modeling Options to define "G=Color".)
 Back to Imagery Menu Summary

RockWare home page