This example highlights the utility of the RockWorks Vertical Images -> Color Model, found in the Imagery menu.
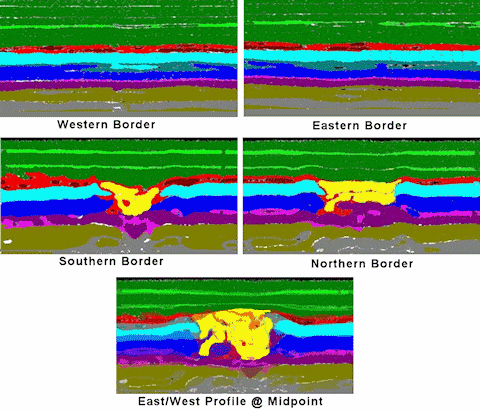
We start with five bitmaps that represent GPR profiles as shown below. These profiles were interpreted (aka "doctored") within a paint program to highlight salient features (e.g. a zone of stratigraphic disturbance associated with a buried object).
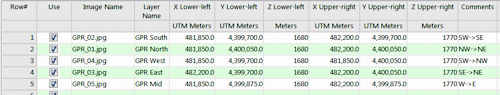
The image names and corner-point coordinates were then stored with the Utilities datasheet as shown below. You need to be sure to define both the map coordinate system and units, and the vertical units, via the Columns | Column Properties window.
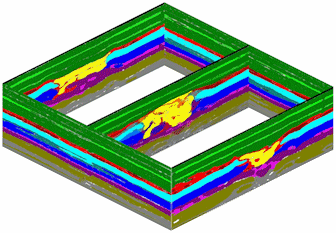
The Imagery | Vertical Images -> 3-D Panels program was then used to display the images in three-dimensions.
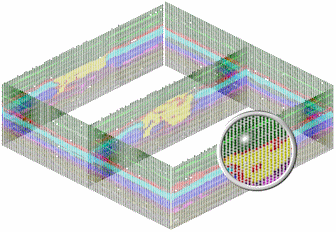
The Imagery | Vertical Images -> X/Y/Z/Color program was then used to converted selected pixels within the GPR images to control points (see diagram below). This program also plots the extracted control points as color-coded spheres. Note: This step is typically unnecessary when creating a model (since the modeling also performs the necessary image-to-control-point extraction). It has been included here in order to illustrate the relationship between the control points and the original imagery.
Next, the Imagery | Vertical Images -> Color Model program was used to create a solid model by using a anisotropic inverse-distance algorithm.
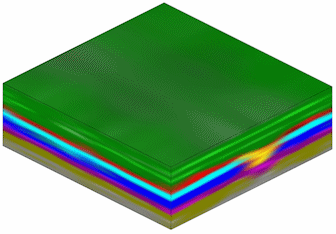
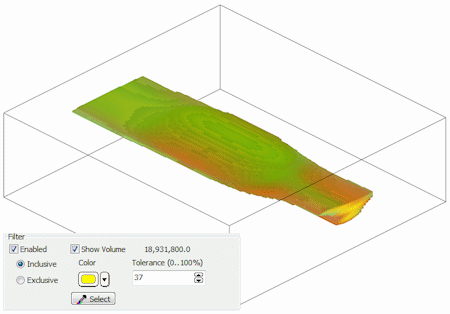
The next step was to set the model filter to the color of interest (yellow) and view the disturbed region (below). Note the volume (19 million cubic meters) represented by the yellow region.
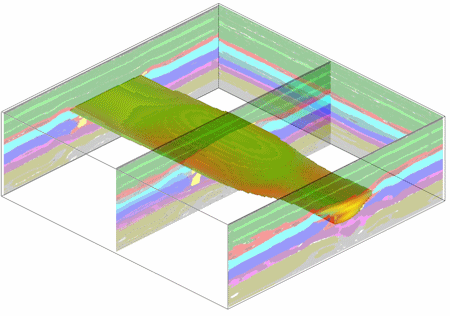
The next step was to append the original GPR profiles with the filtered model. In the diagram below, the western panel has been hidden and the panel transparency has been set to 40%.
![]()