![]() Estimated time: 6 minutes.
Estimated time: 6 minutes.
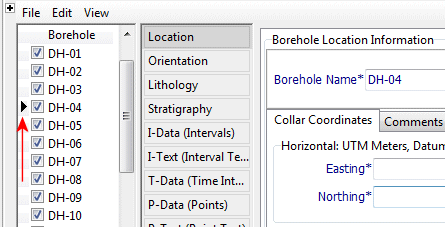
In this lesson, you will get a quick view of all of the stratigraphy data as entered for the project's boreholes. You will look at how the data is entered, and you will generate a 3D diagram representing the borehole stratigraphy logs.
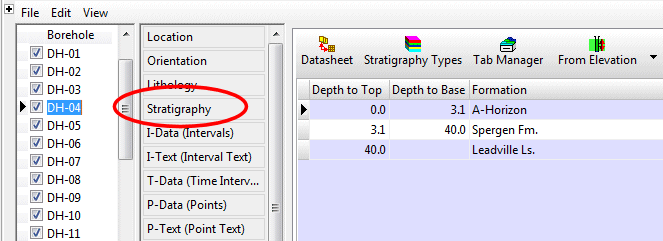
! Note how the stratigraphic units are noted with a top and bottom depth, and a formation name. Missing data can be left blank (as in the Leadville Ls base depth above) and there are a set of "rules" which can help fill in the blanks. You can enter your formations or layers using regular words like "limestone" or "Leadville Ls." In order to know formation order, and the colors and patterns to be used to represent them, the program relies on a reference library called a Stratigraphy Types Table. This is created by the user. A Stratigraphy Types Table is created for each project that has stratigraphy information. We’ll look at this in a minute.
Note how the formations must be consistent in order between boreholes. The formations CANNOT repeat within a single borehole. ("Lithology" by contrast does not show organized layering. See the lessons on lithology diagrams for more information.)
If formations are missing from a particular borehole, you can either omit them altogether, or enter them with the same top and base as the formations above and below (and thus have zero thickness). The latter method allows for better pinching out of surfaces. See Missing Formations for more details.

You can also access the Stratigraphy Types table using the Project Manager pane along the left edge of the program window, in the Project Tables | Types Tables grouping.


A quick summary:
- Order: Defines the order in which the formations are listed in the data tables, the order in which the stratigraphy layers are modeled, and the actual numeric values that will be assigned to the formations should you create a stratigraphic solid model. Numbering starts with upper formations and increases downward.
! This is important. In your own work, be sure the formation order is defined correctly. To edit a value, just click in the cell and type in a new number.- Formation: The formation names in this project.
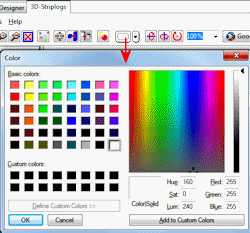
- Pattern: The specific pattern in specific colors for the formation.
- Fill Percent: Defines how much of the available space the pattern block should occupy in strip logs (less than 100% can show erosion, weathering).
- Density: The rock density - used only for computing mass.
- Show in Legend: Used to specify whether the unit's name is to be included in the diagram legends. Un-checking an item doesn't remove it from the table itself, just from any subsequent legends that are created.
! This setting can also be used to limit the stratigraphic modeling to checked formations - helpful in your own work if you have a deep project with many stratigraphic units.- To add a row to the listing, just click in the lowest existing row and press the down-arrow key on your keyboard.
- To delete a row from the listing, click in the row and type Ctrl+Del.
This window has several sections:
The left side is where general diagram settings are established.
The 3D Striplog Designer tab is where you establish the log-specific settings. In this window:
- The left pane is where you choose what type of data is to be displayed in the logs (the Visible Items).
- The upper-right pane is where you see a plan-view preview of the active log items. You can drag the items to adjust their relative placement.
- The lower-right pane displays specific settings for the Visible Item that you click on.
- Establish the general diagram settings in the left pane.
Clip (Truncate Logs Based on Elevation Range): Uncheck this.
Reference Cage: Check this. A 3D grid of lines and coordinate labels will be included.
- Click on the 3D Striplog Designer tab.
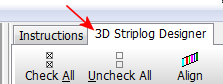
Choose the items you want to see in the logs by inserting a check-mark in the following items in the Visible Items section of the window:

- Adjust the size of the column by dragging on one of the corner handles. Note the Column Radius setting in the lower-right Options pane. As you resize the circle, the Radius setting will be updated. Drag the green stratigraphy circle until the Column Radius is about 1.0.
! You can simply type 1.0 into the Column Radius prompt, if you prefer.- Adjust the placement of the column relative to the axis of the log by dragging the circle in the Preview pane. Be sure the green stratigraphy circle is on the center of the log axis.
! You can simply type 0.0 into the Offset Distance prompt, if you prefer.- None of the other Visible Items should be checked.
The instructions below will take you on a quick tour of RockPlot3D. This lesson will cover different items than were highlighted in the lithology tutorial.
As you can see, the image is displayed in the pane to the right, and the image components and the standard reference items are listed in the pane to the left, called the "data tree."
![]() Back to Stratigraphy menu | Next (2D log section)
Back to Stratigraphy menu | Next (2D log section) ![]()
![]()