 Estimated time: 5 minutes.
 If this is the first lesson you’ve done, please be sure you've (1) opened the Soil_Properties_01.RwDat data file and (2) set the output dimensions.
- First, let's define the default font style you want to use for your 2D maps and diagrams.
- Click on the Preferences menu at the very top of the main RockWorks program window (right side). Choose the General Program Settings menu option.
- Locate the Fonts tab along the left.
- Locate the RockPlot2D Default Font item, and you'll see the current font style to the right (probably Arial). If you would like to choose a different font, click on the current name and choose another from the pop-up list. This tells RockWorks to use the selected font for map labels, contour line labels, cross section labels, etc. Once a map or diagram is displayed, you can edit individual labels as you like.
- You are welcome to look at some of the other program preferences you can establish here.
- Click the OK button at the bottom of the window to close the Settings window.
- Click on the Map menu at the top of the Utilities window, and choose the EZ Map option.
- Input Columns: In the prompts along the left side of the window, be sure the following columns are selected. This tells RockWorks which columns contain the input data. (If the wrong column title is displayed, just click on the down-arrow and scroll up or down to the correct column title.)
- X (Easting): Easting
- Y (Northing): Northing
- Z (Elevation): Elevation
- Next, set up the map layers in the next pane to the right, by clicking on the Options button to the right.
 Background Image: Uncheck.
 Symbols: Check this, so that the map will include location symbols. Click on the Symbols tab to see the options.
- Uniform: Uncheck this.
- Column-Based: Check this option. This tells the program to use symbols stored in a column in the datasheet to represent the map locations. Click on the Column-Based tab to see its settings.
- Symbol Column: Choose the datasheet column named Symbol which, as you might guess, tells the program where to read the symbols from. You may need to scroll upward to find the Symbol column name in the list.
- Dimensions: Choose Uniform, and enter a Size of 1.0. These dimensions represent a percent of the map width. In your own work, should you wish to increase the size of the symbols, just set the Size to a greater percentage.
- Circles: Uncheck this. (This is sed to create scaled "bubble map" symbols.)
- Table-Based: Uncheck this. (This is used to plot specific symbols at specific colors and sizes based on measured values.)
- Images: Uncheck this. (This is used to plot small images at the map locations.)
- Symbol Labels: Check this option to include labels with the symbols, and click on the tab to access the options.
- Content: Use this tab to choose label location and content.
- Plot Label: Northeast: Check this.
- Data Column: Choose the ID column - click on the small down-arrow to see a list of the data columns. This tells the program to plot sample ID labels to the northeast of the symbols. The default text color and background color should be fine.
- Plot Label: Southeast: Check this.
- Data Column: Choose the Elevation data column. This tells the program to plot the elevations to the southeast of the symbols. As above, the default text and background colors should be fine.
- Plot South Label, Plot Southwest Label, etc: The remaining Plot Label check-boxes should be cleared.
- Dimensions: Click on this tab.
- Automatic Offset: Uncheck this. (Note, though, that this is a very nifty tool to use in your own work. It prevents overplotting in crowded maps.)
- Font Size: 1.0
- Initial Offset: 1.0
- The remaining default label options should work well. (horizontal orientation with frames and leader lines.)
- Contour Lines: Uncheck this.
- Color Intervals: Uncheck.
- Triangle Network: Uncheck.
- Border: Check this. Click on the Border tab to look at the options (axis text, etc.).
- Border Dimensions: Choose Output Dimensions.
- The remaining defaults should be fine.
- Click OK to close the Map Options window.
- Click the Process button at the bottom of the EZ-Map window.
The program will create a simple point map. The symbols which are listed in the datasheet will be plotted at the X,Y coordinates specified for the sample sites. Each symbol will contain an ID and elevation label. The map borders will include tick-marks, coordinate labels, and titles.
The completed map will be displayed in a RockPlot2D tab, where 2-dimensional maps and diagrams are displayed. RockPlot2D contains printing, exporting, screen-digitizing and measuring tools, it allows you to combine images, and more. These are covered in the separate RockPlot2D tutorial.
- Maximize the window (using the Windows Maximize button
 in the upper right corner of the window).
- Enlarge the map window by hiding the left-hand Options pane - click on the small "-" button in the middle of the divider bar.
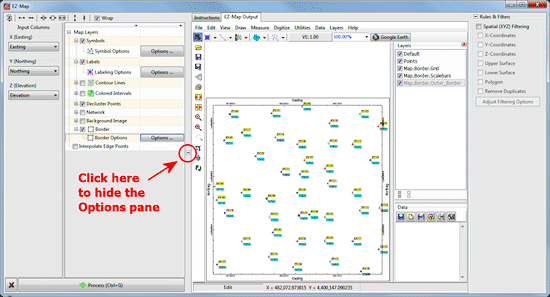
(For reference, you can access the Options pane again by clicking on the small "+" button along the left margin.)

- Move the cursor around the map window, and note that the X and Y coordinates listed at the bottom of the window are updated as you move. Use this feature to view the coordinates for any point on the map.
- Locate the Layers pane: The Layers are displayed to the right of the map. (If they are not, click on the tiny "+" button at the upper right corner of the window, to display the map Layers. Experiment with turning a layer off (by removing the check-mark) and on again.
- Save this map :
- Click on the RockPlot2D File menu, and choose the Save option.
- In the displayed window’s File Name prompt, type in: point map and click the Save button. RockPlot will save the map image under that name, with an ".Rw2D" file name extension.
- Don't close the map window - we're going to make a couple of changes to the options and create a new map.
 EZ Maps
 Back to map menu | Next (EZ contours)

RockWare home page