 Estimated time: 2 minutes.
A Pie Chart Map is a type of symbol map in which each map location is marked with a small pie chart representing a user-selected number of components for that location. We will display the sand-gravel-clay components by site.
! You need to have completed the previous lesson before continuing.
- With the "Soil_Properties_01.RwDat" data set displayed in the main Utilities datasheet, select the Map | Pie Chart Map option.
- Input Columns: Use these prompts along the left to tell RockWorks which column contains which data. To change a column name for any of the prompts simply click on the small down-arrow and select another column name. The prompts and column names you need to establish are listed here:
- Easting (X): Set to the column Easting.
- Northing (Y): Set to the column Northing.
- Set up these components in the large pane of the window.
 Plot Component #1: Checked. This tells the program to include the data for "component 1" in the pie symbols. Expand this heading to access the settings.
- Column: Click to the right to set this to the Sand column.
- Color: Choose a color for this data.
 Explode: unchecked.
- Plot Component #2: Checked. This tells the program to include the data for "component 2" in the pie symbols.
- Column: Click to the right to set this to the Gravel column.
- Color: Choose a color for this data.
- Explode: unchecked.
- Plot Component #3: Check this, so that the program will include another component in the symbols.
- Column: Click to the right to set this to the Clay column.
- Color: Choose a color for this data.
- Explode: unchecked.
- Plot Component 4 – Plot Component 9: Be sure these are all un-checked.
- Radius: Expand this heading to set the Inner Radius to 0.0 and the Outer Radius to 2.0.
- Plot Labels : Insert a check here to include labels with the pie symbols.
- Border : Uncheck this.
- Click the Process button at the bottom of the window to create the map.
The program will read the records in the data set and create for each record a small pie chart illustrating the relative Sand-Gravel-Clay components. The mini-pie-charts will be placed at their sample's X,Y coordinates in the map.
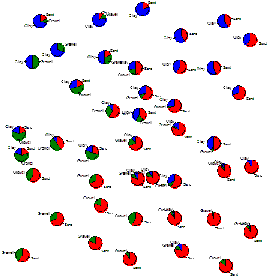
Note how the sandy soils in the southeast grade into clayey soils in the north and west.
If you are interested in adding border annotation to this map, save the map as instructed below, and then jump to the RockPlot2D tutorial.
- Save this map by choosing the File | Save command from the RockPlot menu, entering the file name: pie-map and clicking the Save button.
- Close this window (
 ).
).
 Pie Chart Maps
 Back to component menu

RockWare home page