 Estimated time: 4 minutes.
In this lesson, you will get a quick view of all of the lithology data as entered for the project's boreholes. You will look at how the data is entered, and you will generate a 3D diagram representing the borehole lithology logs.
- Be sure the "Samples" folder is still the current project folder (see Open a Project for information).
- In the borehole file listing along the left side of the Borehole Manager, click on the borehole named "DH-01" to make it active.
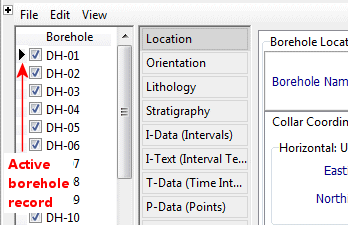
- Click on the Lithology button to view the lithologic data for this hole.
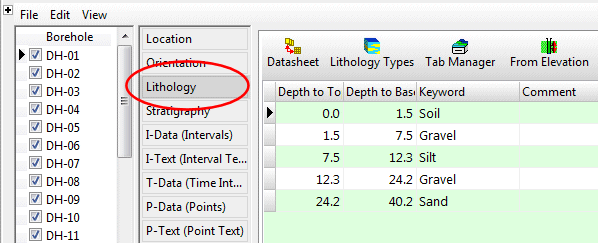
Note how the lithologic intervals are noted with a top and bottom depth, and a lithology "keyword". RockWorks lets you enter your rock/soil types using regular words like "silt" or "sand" or "interbedded sandstone and siltstone." In order to know what "interbedded sandstone and siltstone" is, the program relies on a reference library called a Lithology Types Table. This is created by the user. A Lithology Types Table is created for each project that has lithology information. We’ll look at this in a minute.
- Click on another borehole name in the list to the left, and you’ll see the information listed in its Lithology datasheet.
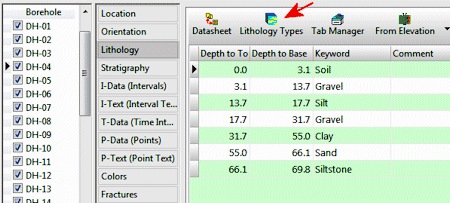
Note also how the rock types can repeat – sand, clay, gravel, clay, sand - within a single borehole. Rock types that don’t show organized layering need to be entered into RockWorks as lithology. ("Stratigraphy" by contrast assumes defined layers that are consistent in order between holes and don’t repeat within a borehole. See the lessons on Stratigraphy diagrams for more information.)
- Look at the project's Lithology Types Table:
- Click on the Lithology Types button that sits above the lithology data listings.
Note that you can also access the Lithology Types table using the Project Manager pane along the left edge of the program window, in the Project Tables | Types Tables grouping:

The program will display this project's lithology types.
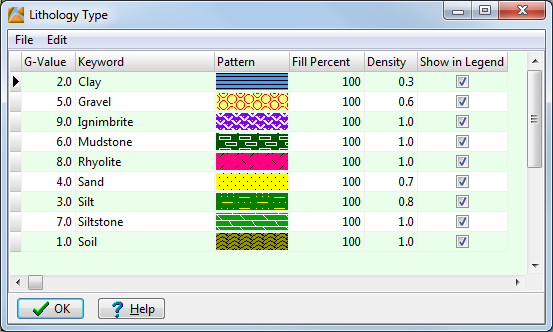
A quick summary:
- G-Value: Lists the numeric value to be assigned to each rock type. As RockWorks creates a solid model of the rock types, the nodes will be assigned these numeric values rather than the words "clay" or "gravel". In the final model, then, all Sand zones will be coded with a "5.0", Silts with a "4.0", Clays with a "3.0", and so on. We'll review this in a later lesson when you create a model of the lithology across the study area.
- Keyword: The rock types in this project.
- Pattern: The specific pattern in specific colors for the rock type.
- Fill Percent: Defines how much of the available space the pattern block should occupy in strip logs (less than 100% can show erosion, weathering).
- Density: The rock density - used only for computing mass.
- Show in Legend: Used to specify whether the material is to be included in the diagram legends. Un-checking an item doesn't remove it from the table itself, just from any subsequent legends that are created.
- To add a row to the listing, just click in the lowest existing row and press the down-arrow key on your keyboard.
- To delete a row from the listing, click in the row and type Ctrl+Del.
You can click on G-Value column heading to sort on those numbers, or the Keyword column heading to sort on the names.
- Click on the OK button to close the Lithology Types Table.
- Let’s create the 3D log diagram. Back at the Borehole Manager, click on the Striplogs menu at the top of the window, and select the 3-Dimensional | Multiple Logs menu option.
This window has several sections:
The left side is where general diagram settings are established.
The Instructions pane displays reference information about the settings. You'll find this in most of the RockWorks program windows.
The 3D Striplog Designer tab is where you establish the log-specific settings. In this window:
- The left pane is where you choose what type of data is to be displayed in the logs (the Visible Items).
- The upper-right pane is where you see a plan-view Preview of the active log items. You can drag the items to adjust their relative placement.
- The lower-right pane displays specific Options for the Visible Item that you click on.
- Establish the general diagram settings in the left pane.
 Clip (Truncate Logs): Uncheck this.
- Reference Cage: Uncheck this.
 Include Lithology Legend: Check this item so that the lithology background colors and the rock type names will be included in the diagram. If you’d like to see the settings, you can expand this heading.
- Include Stratigraphy Legend: Uncheck this.
- Include Well Construction Legend: Uncheck this.
- Include Aquifer Legend: Uncheck this.
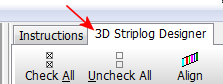
- Click on the 3D Striplog Designer tab.
Choose the items you want to see in the logs by inserting a check-mark in the following items in the Visible Items section of the window:
-
- Title: The drill hole name will plot above the logs.
- Lithology: The logs will contain a column illustrating rock types with cylinders of colors. When the Lithology column is selected, you'll see a yellow circle displayed in the plan-view Preview pane.

- Adjust the size of the column by dragging on one of the corner handles. Note the Column Radius setting in the lower-right Options pane. As you resize the circle, the Radius setting will be updated. Drag the yellow lithology circle until the Column Radius is about 1.0.
! You can simply type 1.0 into the Column Radius prompt, if you prefer.
- Adjust the placement of the column relative to the axis of the log by dragging the circle in the Preview pane. Be sure the yellow lithology circle is on the center of the log axis.
! You can simply type 0.0 into the Offset Distance prompt, if you prefer.
- None of the other Visible Items should be checked.
- Click the Process button at the bottom Options window to proceed.
The program will create a strip log for each borehole, including well name and lithology column, and these logs will be displayed in a new RockPlot3D display tab.
! Each time you click the Process button, the 3D display will be regenerated.
This is a true 3D viewing program – let’s take just a moment to look around.
The image is displayed in the pane to the right, and the image components as well as the standard reference items are listed in the "data" pane to the left of the image. (You can swap the position of the image and data panes using the << or >> buttons above the "linked file list.")
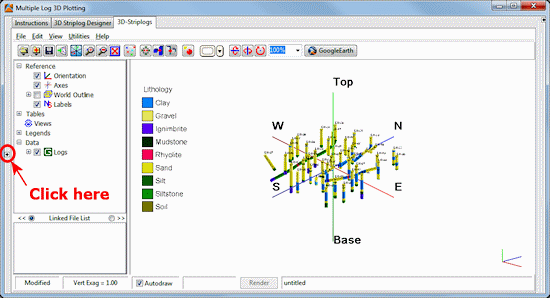
- Enlarge the plot window by hiding the far left menu pane: click on the small "-" button in the middle of the divider.
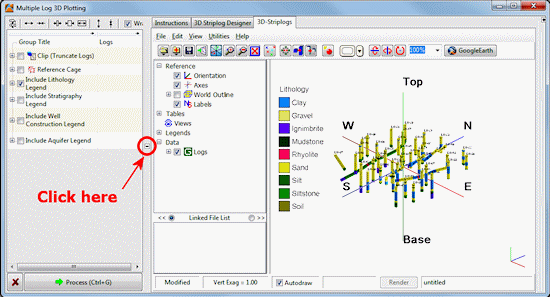
You can later re-display the menu listing by clicking the small "+" button along the left edge.
- Adjust the reference display first:
- World Outline: Turn this off, if it’s displayed, by clearing its check-box in the data pane.
- Orientation, Axes, Labels: Leave these turned on. (Feel free to click any of these on and off to see the effect in the image.)
-
- Adjust the vertical exaggeration: Click on the View Dimensions button
 at the top of the window. In the Vertical Exaggeration prompt toward the bottom of the window, type in 2.0. Click the Apply button at the bottom of the window to apply this change. You may need to move the Options window out of the way to see the logs in the background. Close the Options window by clicking the Close button.
- Rotate the image: The default viewing operation is "rotate" (see the button depressed in the toolbar
 ). Left-click and hold anywhere in the log display and drag to the left or right, up or down and see how the display rotates. Release the mouse button when you are done. Rotate the image again if you wish. Note that the log depth labels always face you even after rotating!
- To restore the view to a fixed viewpoint, choose one from the View | Above, View | Below, or View | Compass Points options. (This can be helpful if you get your image turned upside-down.)
Tip: If you customize the display using a viewpoint that you like, use the View | Add View option to save the viewpoint for later retrieval with a double-click.
- Click on the Pan button
 in the toolbar to reposition the image in the window. This tool is useful if you use the zoom in tool.
- Turn on/off logs or log items: Notice the only listing under "Data" in the data pane is a "Group" named "Logs". Expand the Logs item (by clicking on its "+" button) to see the individual boring names. You can turn entire logs on and off simply by checking/clearing their respective check-boxes. Try this for a few borings.
- In addition, if you expand an individual borehole in the data list, you’ll see its title and lithology intervals. These, also, can be turned on and off for each well. And, if you expand the Lithology for an individual borehole, you can turn on and off display of specific depth intervals.
-
! You might be wondering why the 3D log "tubes" don't contain any lithology patterns. Note that RockWorks displays only the background color in 3D logs and other diagrams, because of the OpenGL 3D graphics engine. In the next lesson, you’ll create a 2D strip log which will display lithology pattern designs.
- Adjust the legend:
- Expand the Legends item (above the log data items) in the data pane. Double-click on the Lithology item. This window can be used to move the legend up/down/left/right, and to scale the legend. It also notes the project’s Lithology Types Table as the source for its colors and labels.
- Try changing the placement from the Left Side to the Right Side and click Apply. Change it back to the Left Side and click Apply again. Click Close to close the Legend Options window.
- Save this 3D log image: Click on the File menu - the menu bar is above the viewing pane - and choose the Save As command. In the displayed window, type in this name: lithology logs and click the Save button. RockPlot3D will save this information on disk under that name, with a file name extension .Rw3D. In later lessons, you can append these logs to other 3D diagrams.
- Close the RockPlot3D window by clicking in the Windows Close button
 .
.
 3D Logs
 Back to Lithology menu | Next (log section)

RockWare home page