RockWorks | Utilities | Survey | Bearing/Inclination/Distance
This program is used to convert survey data to XYZ coordinates, a 2D map, and/or a 3D diagram. The conversion will be based on the known coordinates of the control points and the survey station distance, bearing, and inclination information.
Menu Options
Step-by-Step Summary
Menu Options
- Input Columns
- Control Points: The first four input prompts establish the columns in the datasheet in which you have listed control point information. For each prompt, select the name of the column in the input survey data file in which the requested information is listed. Each control point must be assigned:
- Control Point #: A station number.
- Control Point X: An X-coordinate or easting
- Control Point Y: A Y-coordinate or Northing.
- Control Point Z: An elevation.
- "From" Column: Select the column in the datasheet that lists the station number FROM which the survey measurement was taken.
- "To" Column: Select the column in the datasheet that lists the station number TO which the survey measurement was taken.
- Bearing Column: Select the column in the datasheet listing the compass bearings from the "from" station to the "to" station.
- Inclination Column: Select the column in the datasheet listing the inclination from the "from" station to the "to" station. (0 degrees represents horizontal, positive degrees is upward and negative degrees is downward.)
- Distance Column: Select the column in the datasheet listing the distance from the "from" station to the "to" station.
Note: The X and Y coordinates of the control points, the elevation of the control points, the distance measurements between survey points, and the optional instrument and target heights (below) must all be in the same units, such as feet or meters.
- IH (Instrument Height) Column: If you have included Instrument Height and Target Height fields in the source survey datasheet, select the appropriate column names, and be sure the Include Instrument Height and Include Target Height check-boxes (to the right) are checked. If you do not have these heights listed in the datasheet, be sure those check-boxes are not checked, and the program will ignore these data column prompts.
- Descriptions Column: Here, you can select the datasheet columns that contains any station description. If you have not listed station descriptions in your survey file (they are not required), you may select a blank column title for this prompt.
- Declination: This number will be added to all bearing measurements during the conversions and plotting. It is designed for users who wish to measure relative to magnetic north or for users who wish to correct data in which the compass inclination was improperly set during a survey.
- Inclination Style: In the right pane of the window, expand this item to select how inclination measurements were recorded.
- Include Instrument Height: Insert a check here if you have these heights listed in your datasheet and they are to be considered in the computations.
- Instrument Height Column: Choose the column in the datasheet with the instrument heights. Be sure the units are defined.
- Include Target Height: Insert a check here if you have these heights listed in your datasheet and they are to be considered in the computations.
- Target Height Column: Choose the column in the datasheet with the instrument heights. Be sure the units are defined.
- Symbols and Colors
- Control Points: Choose a symbol and color to be listed for the control points in the output file.
- Survey Points: Choose a symbol and color be be listed for the survey points in the output file.
- Create XYZ Table: Insert a check here to compute the XYZ coordinates for the survey sites.
- Create 2-Dimensional Map: Insert a check here to compute the survey point coordinates and plot all of this data as a 2-dimensional plan-view map.
- Symbols: Insert a check here to display the control point and survey station locations on the map. Set the size as a percent of the map width.
- Elevation Labels: Insert a check in this box to include labels representing program-computed station elevations or the given control point elevations. Expand this heading to choose the font size, color, and offset.
- Coordinate Labels: Check this box to include labels representing the program-computed X,Y coordinates for the stations, or the given X,Y coordinates for the control points. Expand this heading to choose the font size, color, and offset.
- Station Numbers: Insert a check in this box to include labels representing the station numbers taken directly from the datasheet. Expand this heading to choose the font size, color, and offset.
- Observation Labels: Check this box to include labels representing the observations taken from the optional description field in the datasheet. Expand this heading to choose the font size, color, and offset.
- Traverse Lines: Check this box to include survey traverse lines in the output map. Expand this to select line style.
- Traverse Labels: Check this box to annotate the lines with azimuth bearing, inclination, and distance as read from the datasheet. Expand this to set label size and color.
- Border: Insert a check here to annotate the map borders with axis titles and/or coordinate labels. Expand this item to access its settings. See Border Layer Options for details.
- Create 3-Dimensional Diagram: Check this box to compute the survey point coordinates and plot all of this data as a 3-dimensional diagram.
- Spheres: Activate this setting to represent the control points and computed X,Y locations with spheres on the 3D diagram. Expand this item to set the sphere radius as a percent of the diagram size.
- Station Labels: Check this if you want to include labels in the output diagram. Expand this heading to define those labels.
- Leader Lines: Check this to include lines between the labels and the points.
- Elevations: Check this to include elevation labels, representing program-computed station elevations or the given control point elevations. Expand this heading to set label size, color, and offset.
-
- Coordinates: Check this to include coordinate labels, representing the program-computed X,Y coordinates for the stations, or the given X,Y coordinates for the control points.
- Station Numbers: Check this to include labels representing the station numbers taken directly from the datasheet. Expand this heading to choose the font size, color, and offset.
- Observations: Check this box to include labels representing the observations taken from the optional description field in the datasheet.
- Traverse Lines: Check this box to include survey traverse lines in the output diagram. Expand this to select line color and radius.
- Traverse Labels: Check this box to annotate the lines with azimuth bearing, inclination, and distance as read from the datasheet. Expand this to set label size and color.
- Panels: Insert a check here to plot any panels for which you have declared 3 or 4 corner points in the datasheet (and have specified the input columns in P1 - P4, above.) These can be a helpful way to display cave or mine configurations.

- Reference Cage: Insert a check here to include vertical elevation axes and X and Y coordinate axes in the 3D diagram. Expand this item to set up the cage items. (More.)
Step-by-Step Summary
- Access the RockWorks Utilities program tab.
- Open / create / import the survey data. (Sample file = "\RockWorks17 Data\Samples\Survey_01.RwDat")
- Select the Survey | Bearing/Inclination/Distance menu option.
- Enter the requested menu settings, described above.
- Click the Process button to continue.
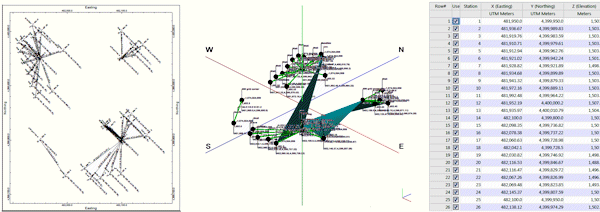
The program will, as requested:
Compute the XYZ coordinates from the source survey information, and list them in a data tab to the right.
Create the map with the requested items, and display the image in the RockPlot2D tab to the right.
Create the 3D diagram with the requested items, and display the image in the RockPlot3D tab to the right.
 Back to Survey Menu Summary

RockWare home page