
RockWorks | Borehole Manager | Striplogs | Compute Horizontal Borehole Path | Plot 3D Well Path
This program is used to compute the optimum path for a wellbore, given a starting XYZ point, an ending XY location, upper and lower payzone grid models, and borehole curvature, smoothing, and depth increment settings.
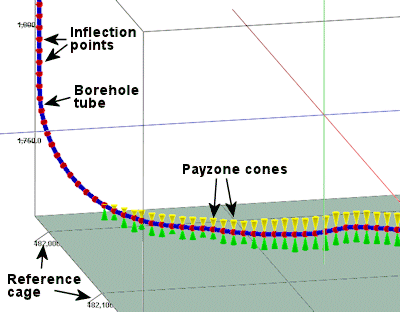
Once the optimum path is computed, the program will create a 3-dimensional borehole diagram, illustrating the well axis with a tube, and the payzone thickness with cone-shaped symbols along the well.
! Assumptions:
- The wellbore starts out vertically.
- True depth within the XYZ report is relative to the initial point – not the ground surface.
- There are no null nodes within the grids along the course of the wellbore.
- The grid models (RwGrd files) for the top and base of the payzone already exist in the project. These can be imported, or created in RockWorks using its stratigraphy modeling or other grid-based tools.
 A video that demonstrates these capabilities can be viewed at: http://youtu.be/gLRuNCKhkUc
See also:
- XYZ Points to get a list of the downhole points, true depths, and formation thickness, along computed wellbore
- Downhole Survey to get a list of the depth/bearing/inclination survey values
- Plot 2D Path to display the wellbore and payzone in 2D cross-section
Menu Options
Step-by-Step Summary
Menu Options
- Initial Point: Use these settings to define the location of the start of the wellbore. These must match the coordinate system and units currently established for the other holes in the borehole database.
- X (Easting): Click to the right to type in the X coordinate for the top of the well.
- Y (Northing): Click to the right to type in the Y-coordinate for the top of the well.
- Z (Elevation): Click to the right to type in the Z (elevation) coordinate for the top of the hole.
- Final (TD) Point: Use these settings to define the map location for the end of the wellbore. Note that the final elevation will be determined by the payzone grid models and borehole properties defined below.
- X (Easting): Click to the right to type in the X coordinate for the end of the well.
- Y (Northing): Click to the right to type in the Y-coordinate for the end of the well.
- Borehole Properties: Use these settings to define the angularity of the hole.
- Radius of Curvature: Click to the right to type in the radius of the circle that will best fit the optimal well path. The greater the value you enter, the larger the circle, and the more gradual the well curve to horizontal. Some examples are shown below.

-
- Depth Increment: Click to the right to type in the depth or distance increment at which the path is to be computed. The smaller the increment, the smoother the path.
- Smoothing Factor: Click to the right to type in the number of smoothing passes to run on the path.
- Pay-Zone: Use these settings to define the top and base surfaces for the formation of interest, into which the wellbore will be projected.
-
- Superface (Top) Grid Model: Click to the right to browse for the name of the existing grid model (.RwGrd file) that represents the surface at the top of the formation of interest. This could be a surface generated using the Stratigraphy modeling tools in RockWorks, or a grid that you've imported from another source.
- Subface (Base) Grid Model: Click to the right to browse for name of the existing grid model that represents the surface at the base of the formation of interest.
- Diagram Options: Use these settings to adjust the appearance of the output diagram. See the graphic example below.
- Plot Inflection Points: Check this box to plot spheres along the well path at the depth increments defined above.
- Point Radius: Click to the right to enter the point radius, as a percent of your project size (default = 1.0). The larger the value, the larger the spherical symbol.
- Point Color: Click to the right to select the color for the inflection points.
- Plot Borehole Tube: Check this box to display the well path with a 3D tube.
- Tube Radius: Click to the right to enter the tube radius, as a percent of your project size (default = 1.0).
- Tube Color: Click to the right to choose the color for the 3D tube.
- Plot Pay-Zone Top/Bottom Cones: Check this box to include cone symbols which extend from the wellbore tube to the top and base payzone surface you defined above.
- Cone Radius: Click to the right to enter the cone radius, as a percent of your project size (default = 1.0).
- Upper Cone Color: Click to the right to choose the color for the upper cones (shown in yellow below).
- Lower Cone Color: Click to the right to choose the color for the lower cones (shown in green below).
- Reference Cage: Insert a check here to include vertical elevation axes and X and Y coordinate axes in the 3D diagram.
- Expand this item to set up the cage items. (More.)
Step-by-Step Summary
- Access the Borehole Manager program tab.
- Select the StripLogs | Compute Horizontal Borehole Path | Plot 3D Well Path menu command.
- Enter the requested menu options, described above.
- Click the Process button at the bottom of the window to continue.
The program will compute the optimum borehole path between the starting and ending point within the specified payzone surfaces, given the borehole parameters and depth increment you specified.
The resulting wellbore will be displayed in a 3D diagram, illustrating the well path, inflection points, and payzone thickness as requested. The completed diagram will be displayed in a RockPlot3D tab in the Options window.
- You can adjust any of the options in the pane to the left and then click the Process button again to regenerate the diagram.
! Each time you click the Process button, the existing display will be replaced.
! Tip: You can undock the plot window using the  button.
- View / save / manipulate / print / export the section diagram in the RockPlot3D window.
 Back to StripLogs Menu Summary

RockWare home page