RockWorks | Borehole Manager | Stratigraphy | Stratigraphic Thickness | 3-Dimensional
Use this program to:
- Read a listing of stratigraphic contacts from the Borehole Manager database.
- Interpolate a grid model representing the top or base of the selected top formation, across the project area.
- Interpolate a grid model representing the top or base of the selected lower formation, across the project area.
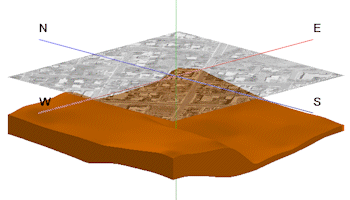
- Create a surface representing the upper-formation's top, a surface representing the lower-formation's base, and enclosing sides.
- Plot the view in RockPlot3D.
- Display the computed volume and mass of the selected formation.
! The mass computation is based on the density per cubic unit as declared in your Stratigraphy Types Table.
Feature Level: RockWorks Standard and higher
Menu Options
Step-by-Step Instructions
Menu Options
- Superface/Subface Options: Expand this as necessary to specify the formation(s) whose thickness is to be modeled.
-
- Unit Top: Click on the formation name to the right to select the stratigraphic unit whose top or base is to represent the upper surface of the isopach model.
- Top of Unit: Click this radio button if the upper surface of the isopach model is to be the top of the selected formation.
- Base of Unit: Click this button if the upper surface of the isopach model is to be the base of the selected formation.
- Unit Base: Click on the formation name to the right to select the unit whose top or base is to represent the lower surface of the isopach model.
You can specify different formations for the top and the base, and the entire thickness between will be computed. The formation names that are listed here are read from the current Stratigraphy Types Table.
- Top of Unit: Click this radio button if the lower surface of the isopach model is to be the top of the selected formation.
- Base of Unit: Click this button if the lower surface of the isopach model is to be the base of the selected formation.
- Gridding Options: Click on the Options button to the right to establish the gridding method (aka algorithm), the grid dimensions, and other gridding options. These will be used as the program "grids" or models the surface elevations and base elevations of the selected formation(s), and stores the difference in a thickness grid.
- Algorithms: Select a gridding method from the list on the left, and establish the method-specific Options in the middle pane.
- Grid Dimensions: Specify how the grid dimensions are to be established, using the settings on the right side of the dialog box. Unless there's a specific reason to do otherwise, you should probably leave the grid dimensions set to the current project dimensions.
- Additional options: Establish the other general gridding options (declustering, logarithmic, high fidelity, etc.).
- Diagram Options:
- Hide Thin Zones: Check this box to hide portions of the isopach model that are thinner than a user-specified cutoff.
- Thickness cutoff: Click here to type in the visible threshold. For example, if you wanted the program to hide all zones where the thickness is less than 0.5 feet, you would type in 0.5.

- Reference Cage: Insert a check in this box to include a 3-dimensional frame around the surfaces, with coordinate labels. More.
- Rules & Filters: Use the settings on the far right side of the window to apply stratigraphic rules to data being processed here. More.
Step-by-Step Summary
Follow these steps to create a 3-dimensional image that represents the thickness of a single stratigraphic unit or adjacent units.
- Access the RockWorks Borehole Manager program tab.
- Enter/import your data into the Borehole Manager database. This tool specifically reads location, orientation (if any), and stratigraphy data.
- Select the Stratigraphy | Stratigraphic Thickness | 3-Dimensional menu option.
- Enter the requested menu settings, described above.
- Click the Process button when the gridding and diagram settings are established to your satisfaction.
- If you have activated the gridding Dimensions / Confirm Dimensions option, the program will display a summary window with the grid boundary coordinates and node spacing. Adjust these items if necessary and click OK. More.
The program will read the depth intervals for the selected stratigraphic unit(s) as listed in the project's Stratigraphy tabs. It will internally translate depths to elevations based on the boreholes' surface elevations and downhole surveys. It will create two grid models, of the upper-formation's upper or lower elevations (as selected) and of the lower-formation’s top or base elevations, using the selected gridding method. The display in RockPlot3D will show the upper surface, lower surface, and enclosing sides. In the Data section in the RockPlot3D outline pane, you will see these entities, and the computed volume and mass values. The completed diagram will be displayed in a RockPlot3D tab in the Options window.
- You can adjust any of the options along the left and click the Process button to regenerate the grid models and the surfaces.
! Each time you click the Process button, the existing display will be replaced.
- View / save / manipulate / print / export the image in the RockPlot3D window.
Tips: Turn on/off the upper and lower surfaces or sides using the check-boxes in RockPlot3D's Data section. To adjust the surfaces' or sides' appearance (color or transparency), double-click on the formation's "Top" or "Base" or "Sides" entry. To adjust the vertical exaggeration, use the View | Dimensions menu option or click on the toolbar’s Stretch button. To add an already-saved 3D image of the project's striplogs, for example, or another thickness image, choose the File | Append command. Float an aerial photo over the thickness image (as shown in the example above): use the Utilities | Imagery | Float tool, and append that image.
 Back to Stratigraphy Menu Summary

RockWare home page