
RockWorks | Utilities | Statistics | Variography
Use this program to read XYZ data from the Utilities datasheet and generate variogram reports and graphs, showing the variability of the Z values for point pairs as a function of the distance between the points. RockWorks creates observed variograms of your data, and then finds the variogram model that offers the best fit - thus defining the distance and directional relationships in your data.
These tools are the same as those offered with the Kriging gridding method.
See also: What is a Variogram, Kriging
Menu Options
Step-by-Step Summary
Menu Options
- Input Columns: Use these prompts along the left side of the window to define the columns in the RockWorks Utilities datasheet that contain the X, Y, and Z data to be analyzed.
- X (Easting): Select the column in the datasheet that contains the X or Easting coordinates to be analyzed.
- Y (Northing): Select the column that contains the Y or Northing coordinates.
- Z (Elevation): Select the column that contains the Z values to be analyzed for variability. The Z values can be any measured values, such as elevation, quantitative values (geochemistry), etc.
- Variogram Options: These settings determine whether you want the program to do most of the heavy-lifting ("Automatic") or whether you want full control ("Manual"). Many users find it helpful to run the variogram analysis automatically, with a variety of reports, and then refine the analysis manually.
- Automatic: Click in this radio button if you want the program to set the variogram variables automatically for you (probably the best place to start). When set to Automatic, the program will determine the best-fit variogram type, based on the type with the highest correlation with your data. It will search the data using a variety of spoke directions and variogram types.
- Manual: Click this button if you prefer to set the variogram variables manually.
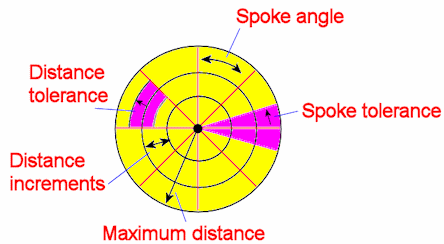
- Spoke Spacing: Since variograms represent point-to-point variability, the program creates a set of point pairs to work with. Rather than analyzing all possible pairings between all data points (a huge number), the program will sample point pairs along specific directional bearings. These bearing lines can be conceptualized as bi-directional "spokes" running through the data points; you define the spacing in degrees between sampling spokes. For example, a 45 degree spoke spacing will generate 4 bi-directional spokes (180 / 45 = 4), and a 30-degree spoke spacing will generate 6 spokes.
- Spoke Tolerance: Since it is unlikely that many data points will lie along the narrow directional lines established above, you need to establish a "tolerance" or zone alongside each bearing line to include in the data point search. The default is 22.5 degrees.
- Distance Increments: In addition to the program searching for data points in a directional manner, it also searches in an orderly, step-wise manner, along each bearing line at certain distance increments. These are expressed in map units. The default is 250.
- Distance Tolerance: It is unlikely that data points lying within the directional search zone will fall right on one of the distance increments, so it is necessary to establish a tolerance zone around each increment to widen the search area. This is also expressed in map units. The default is 125.
- Maximum Distance: This variable establishes the maximum distance from each data point that the data search will be conducted, in map units.
- Interactively Edit / Examine Variogram: Check this box to see the interactive Variogram Editor.
- Reporting Options:
- Textual Report: Check this box to generate a textual report that lists the detailed variogram results.
- 2D Variogram Matrix: Check this box to generate a detailed diagram that depicts all of the variograms, and a large number of other statistics. (See 2D Variogram Matrix for details.)
- Items: Use these check-boxes to select which variogram models you wish to include in the matrix diagram.
- Variograms per Row: Defines the maximum number of variograms to be plotted per row, for each activated variogram type. Default = 10.
(Typically you won't have that many. For a 90 degree spoke spacing, you'd have two variograms per model. For a 45 degree spoke spacing, you'd have 4.)
Step-by-Step Summary
- Access the RockWorks Utilities program tab.
- Enter/import your XYZ data into the Utilities datasheet.
- Click on the Stats menu and choose the Variography option.
- Enter the requested menu settings, described above.
- Click the Process button at the bottom of the window when you are ready to proceed.
If you've selected Automatic variography, the program will compute the average minimum and maximum spacing of your control points, to suggest default sampling distance increments and total distance. It will search for point pairs at 90 degree spoke increments using these lag bins, and then at successively smaller spoke increments, pitching bins without a minimum number of samples. It will compute the observed variograms for all spoke samples, and will determine the variogram model that has the best correlation.
If you've selected Manual variography, the program will search for point pairs along the spoke and distance increments you've specified, out to the maximum distance, and will compute the observed variograms for these bearings. It will fit the selected variogram model to the data.
If you have requested to Edit / Examine Variogram, the best-fit variogram model will be displayed, along with a reference range plot. Adjust this as you wish, and click OK. (See Examining and Editing Variograms for details.)
If you've requested the text report or 2D variogram matrix, they will be displayed in a text tab and/or a RockPlot2D tab in the Options window.
- You can adjust the variogram settings in the Options pane to the left and click the Process button again to re-generate the output.
 Back to Statistics Menu Summary

RockWare home page