The Edit | Examine Variogram option in the Kriging Options window is used to bring up the interactive Variogram Editor. The Variogram Editor can be used to interactively fit a variogram to your data points, allowing you to define the true directionality of your data, which will be applied as the grid model or solid model is interpolated.
Some definitions:
- Variogram: See What is a Variogram for basic information about variogram plots and models.
- Major Axis: The bearing, if any, along which samples are more related at greater distances. (Is bi-directional, so the major axis includes 180 degrees opposite.)
- Minor Axis: The bearing that is perpendicular to the Major Axis. (Is bi-directional, so the minor axis includes 180 degrees opposite.)
- Range: The point-to-point distance beyond which which samples are no longer considered related.
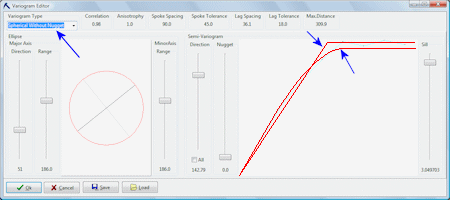
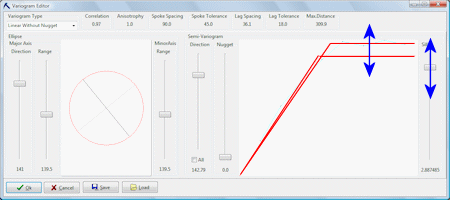
- Sill: Where the variability curve flattens out.
- Nugget: If the variogram does not go through the origin, that jump up the Y axis is called the "nugget". It indicates that even at very close distances there is some variability.
- Correlation: This correlation coefficient reports how well the variogram model fits the data. 1 = perfect direct relationship, 0 = no relationship, -1 = perfect inverse relationship.
- Anisotropy: This reports the directionality of the data, and equals the minor-axis-range / major-axis-range. The closer to 1, the less directional (or anisotropic) the data.
- Spoke Spacing: Azimuth angle (in degrees) between point-pair sampling spokes.
Since a variogram compares point values based on distance, it relies on a bunch of point pairs to do this comparison. Instead of using all possible point pairs (a potentially huge sample), the points are sampled along spoke and distance (or lag) increments.
- Spoke Tolerance: Azimuth angle (degrees) to either side of the spokes within which samples will be pulled.
- Lag Spacing: Distance increment (in map units) along the spoke bearings at which samples will be pulled.
- Lag Tolerance: Distance along either side of the lag increments within which point pairs will be pulled.
When the Variogram Editor is first displayed, you'll see something like this, with the best-fit variogram displayed (Automatic Kriging) or the user-selected variogram displayed (Manual Kriging):
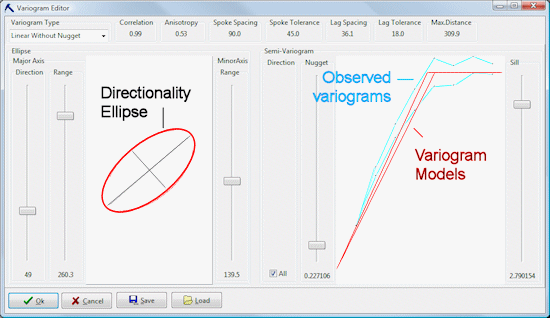
The Directionality Ellipse tells you the directionality or anisotropy of your data:
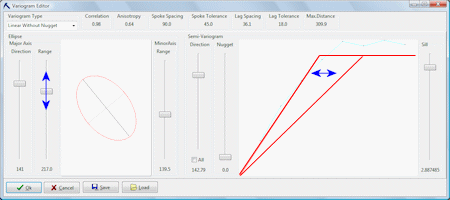
- Its tilt indicates the direction of the Major Axis. This is the bearing along which distant data points are more related. The actual bearing represented by the tilt is indicated at the bottom of the Major Axis Direction slider bar.
- Its length indicates the range of the Major Axis. This tells you the distance beyond which the relatedness starts to diminish. The actual range value (distance, in your map units) is indicated at the bottom of the Major Axis Range slider bar.
- The Minor Axis is perpendicular to the Major Axis.
- The shape of the ellipse indicates how directional the data is: If the ellipse is narrow, then relatedness along that axis diminishes more quickly at distance. The actual range value of the Minor Axis is displayed at the base of its slider bar.
The Variogram plot displays your actual data (in blue) against the current Variogram Model (in red):
- The current Variogram Model can be selected using the Variogram Type drop-down list in the upper-left corner of the window.
- The number of Observed Variogram graphs complies with the number of spokes along which the data was compared. For example, if the spoke spacing is 90, then there will be two observed variograms (180 / 90 = 2). If the spoke spacing is 45, then you'd see 4 observed variograms (180 / 45 = 4). The spokes are bi-directional in nature.
- You can view individual variograms by removing the check from the "All" check-box, and dragging the Direction slider bar to view specific plots at specific bearings.
Step-by-Step Summary
- To accept the displayed variogram information, just click the OK button. As it interpolates the grid or solid model node values, the kriging routine will determine the appropriate weights to assign to the data points to minimize the error of estimation based on the chosen variogram model.
- If you want to experiment a bit with the variogram editor, here are some tips.
- Variogram Type: Select a different variogram model from this drop-down list at the top of the window. You'll see an update in the Variogram display and the Ellipse plot based on the new variogram type.
- Refine the plot:
- View variograms for specific bearings by removing the check-mark in the Direction / All box. You can then use the Direction slider bar to view the plot for a specific bearing. For example, if the Major Axis is displayed as 140 degrees, you can view that variogram.
- Drag the Major Axis slider to adjust the variogram fit.
- Drag the Sill slider bar to adjust the location of the sill.
- Save your changes: You can click the Save button at the bottom of the window to save the current settings to a text file in your project folder. This file lists the following details:
5 <--- Type of variogram.
140.8 <--- Major Axis Direction.
158.07 <--- Major Axis Range.
139.47 <--- Minor Axis Range.
0.00 <--- Nugget.
3.18 <--- Relative Sill.
- Load previous settings: If you've previously saved the list of variogram settings, you can click on the Load button to load these settings into the Variogram Editor.
 Back to Kriging (Grid Models)
Back to Kriging (Solid Models)
Back to Stats | Variography

RockWare home page