RockWorks | Utilities | Grafix | 3D-Utilities | Triangles
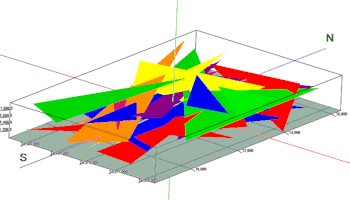
This program is used to plot a series of colored triangles in 3-D space. The input consists of a datasheet which contains the coordinates for each triangle vertex.
Menu Options
Step-by-Step Summary
Menu Options
- Input Columns: The prompts along the left side of the window tell RockWorks which columns in the input datasheet contain what data.
Click on a displayed name to select a different name from the drop-down list.
- Title Column: Datasheet column that defines the triangle title. This title will be used when grouping the triangles within the RockPlot3D data tree.
- Color Column: Datasheet column that defines the triangle color.
- X1 Column: Datasheet column that contains the X (Easting) coordinate for the first triangle vertex.
- Y1 Column :Datasheet column that contains the Y (Northing) coordinate for the first triangle vertex.
- Z1 Column: Datasheet column that contains the Z (Elevation) coordinate for the first triangle vertex.
- X2 Column: Datasheet column that contains the X (Easting) coordinate for the second triangle vertex.
- Y2 Column; Datasheet column that contains the Y (Northing) coordinate for the second triangle vertex.
- Z2 Column: Datasheet column that contains the Z (Elevation) coordinate for the second triangle vertex.
- X3 Column: Datasheet column that contains the X (Easting) coordinate for the third triangle vertex.
- Y3 Column: Datasheet column that contains the Y (Northing) coordinate for the third triangle vertex.
- Z3 Column: Datasheet column that contains the Z (Elevation) coordinate for the third triangle vertex.
- Thickness: Thickness (in pixels) of each triangle.
Be sure to define the coordinate system and units for all of the vertices.
Step-by-Step Summary
- Access the RockWorks Utilities program tab
- Create a new datasheet and enter or import your XYZ location triplets, sample IDs, and colors into the datasheet.
Or, open one of the sample files and replace that data with your own. See 3D Triangles Data format for details.
- Select the Grafix | 3D-Utilities | Triangles menu option.
- Specify the requested menu items, as described above.
- Click the Process button to continue.
The program will read the indicated XYZ location coordinates and plot a triangle between the points, using the color specified. The diagram will be displayed in a RockPlot3D tab in the Options window.
- You can adjust any of the options along the left and click the Process button to regenerate the 3D image.
! Each time you click the Process button, the existing display will be replaced.
- View / save / manipulate / print / export the image in the RockPlot3D window.
See also: Computing Plane Orientations based on Three Points to compute the strike and dip of three-point planes.
 Back to Grafix Menu Summary

RockWare home page