
RockWorks | Utilities | Grid | Math | Resample
This program reads an existing grid model (.RwGrd file) and create a new model based on the current project dimensions. You can use this tool to resize grid models that are to be filtered against each other or run through mathematical operations with each other (so that they have the same dimentions and node spacing), or to resize a single grid model destined to be used to filter a solid model (again, so that the XY dimensions and node spacing are the same). This can also be a handy way to resize an imported grid model to your project dimensions.
Menu Options
Step-by-Step Summary
Menu Options
- Input Columns: If you request plotting of 2D map symbols (below) AND if you have data loaded into the Utilities datasheet, you can use these prompts (along the left edge of the Options window) to specify the X and Y locations for the map symbols.
! If you don't plot map symbols, these will be ignored.
- X (Easting): Click to the right to select the name of the column containing the X or Easting coordinates.
- Y (Northing): Click to the right to select the name of the column containing the Y or Northing coordinates.
- Input (Grid) Model: Click to the right to browse for the name of the existing grid file (.RwGrd file) that the program is to read and manipulate.
- Output (Grid) Model: Click here to type in the name to assign to the new grid file that the program will create, which results from the grid resampling operation.
- Adjust Output Dimensions: Click here if you need to view or edit the current output dimensions. The output grid model will be generated using the current output dimensions settings. (See Viewing and Setting Your Output Dimensions.)
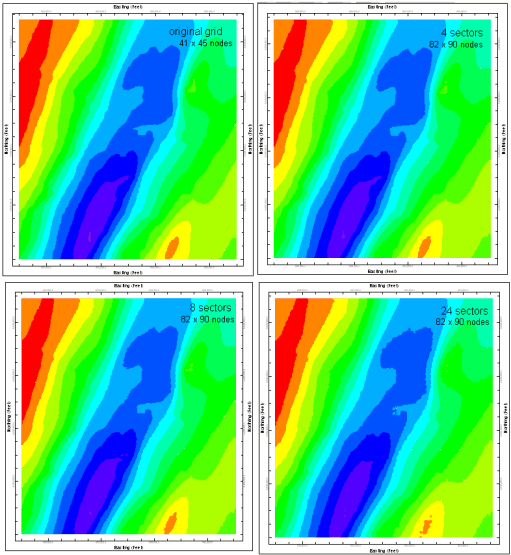
- Sector Based: Choose this option to use a sector-based resampling method. For each node within the new model, the program will locate the closest node from the original grid within each sector. These sectors are defined by a user-defined search angle. For example if the user specifies a 90-degree search angle, the program will find the closest point within each of the four quadrants (sw,nw,ne,se). These nodes are then used to estimate (via an inverse-distance-squared algorithm) a value for the new node.
! This method can be very slow with large models.
- Searching/Sampling Increments: Expand this heading to select the number of sectors in the original grid to be searched for control points for the resampled grid. Choose 90 Degrees (4 sectors) to have the program use 4 original grid nodes to interpolate each new grid node. Choose 45 Degrees (8 sectors) to have the program use 8 original grid nodes to interpolate each new grid node. And so on.
Generally using 90 Degree or 45 Degree sectors will be adequate; the examples below show how increasing the number of sectors may create artifacts in the model.
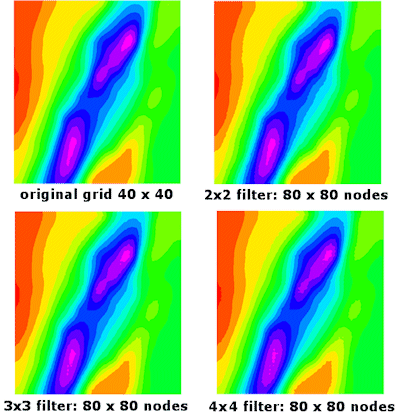
- Filter Based: Choose this option for a much faster resampling method. Under this scheme, for each node in the output grid, the program looks at the closest n nodes in the original grid, and computes their average.
2x2: average of the 4 closest nodes.
3x3: average of the 9 closest nodes.
4x4: average of the 16 closest nodes.
The 2x2 filter is faster while the larger filters provide more smoothing. Filter-based resampling is significantly faster than sector-based resampling but may show some edge effects. In the following example, a grid was resampled to be more dense, using the indicated filters. In the second example, a grid was resampled to be less dense.

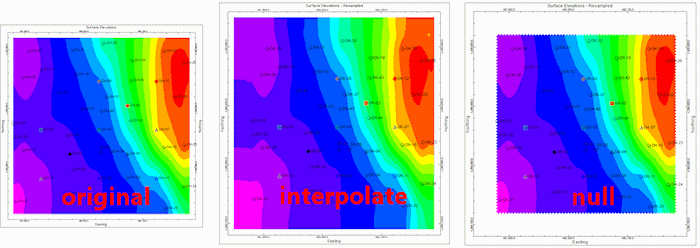
- Nodes Outside the Input Grid: Use these settings to define what should happen to filter-based resampled nodes outside the original grid model, if you are resampling a smaller grid to a larger space.
- Interpolate: Choose this option if the outer nodes are to be interpolated to the expanded model edges. This is the default setting and should be selected if the intent is to "grow" the grid model to the larger output dimensions.
! Note that if null values occupy the edge of the grid, then the null values will be extended to the new outer border.
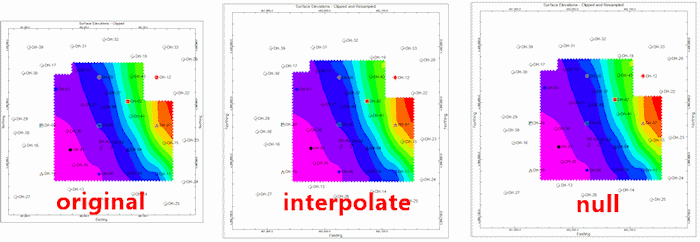
- Use Default Value: Choose this option if you prefer to assign a specific value to the outer nodes. This would be a good choice if the source grid has been clipped with a polygon which lies along any of the original boundaries.
- Null: Choose this if the default value is to be null.
- Other Value: Choose this if you want to define a specific real number value for the outer nodes.
- Create 2-Dimensional Grid Diagram: Insert a check in this check-box if you want to display the output grid as a 2D map at this time. Expand this heading to set up the 2D map layers (bitmap, symbols, labels, line contours, color-filled contours, labeled cells, and/or map border).
- Create 3-Dimensional Grid Diagram: Insert a check in this check-box if you want to display the output grid as a 3D surface. Expand this heading to set up the 3D map layers (flat surface, Boolean colors, perimeter, reference cage). You can request both a 2D and 3D representation of the grid model.
- Create Grid Statistics Report: Insert a check here if you want to see a report summarizing the output grid.
- Include Standard Deviation: Check this box if you want the report to include standard deviation.
- Include Directional Analysis: Check this box to include slope, aspect, and strike computations. Be warned that these can take a few moments for large grid models.
Step-by-Step Summary
- Access the RockWorks Utilities program tab so that you can see the Grid menu.
- If you'll be creating a 2D map with sample location (well) symbols, you can use the File | Open option to open the .RwDat file containing the X and Y location coordinates for the map symbols.
- Select the Grid | Math | Resample menu option.
- Enter the requested menu settings, described above.
- Click the Process button to continue.
The program will load the input grid file, recreate the grid model using the selected method and current project dimensions, and store the resulting grid file on disk under the output file name you selected.
The requested diagram(s) will be displayed in a RockPlot2D tab and/or RockPlot3D tab in the Options window. If you requested a statistics report, it will be displayed in a Text Tab in the Options window.
- You can adjust any of the settings in the Options window and then click the Process button again to regenerate the diagram(s).
! Each time you click the Process button, the existing display(s) will be replaced.
- View / save / manipulate / export / print the diagram in the RockPlot2D or RockPlot3D window.
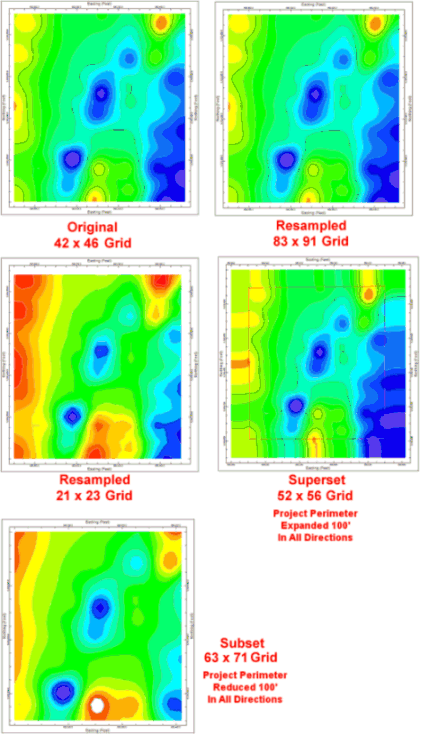
The Grid-Resample program may be used to generate higher- or lower-resolution models based on an existing grid model. It may also be used to create grids that represent supersets or subsets of an existing grid. Grids that are larger than the original grid may suffer from projected edge effects that may be adjusted by changing the search sector angle.
 Back to Grid Menu Summary

RockWare home page