RockWorks | Utilities | EarthApps | Cell-Map Menu
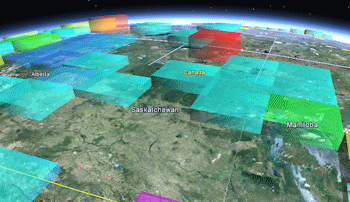
Use the programs in the Utilities | EarthApps | Cell-Map menu to read XY locations and any measured values from the Datasheet Editor and create color-coded cell maps in Google Earth which represent frequencies, minimum or maximum values, averages, interpolated values, etc. This topic summarizes the programs that are available - click on a link or picture for more information.
Table of Contents
| Average | Cumulative | Distance | |||
| Frequency | Minimum | Maximum | |||
| Weighted | Advanced | ||||
![]() Back to EarthApps Summary
Back to EarthApps Summary
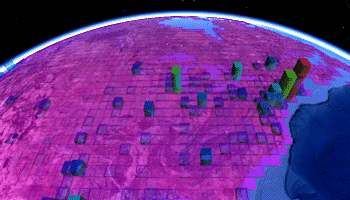
Average: The cell map represents the average Z value for samples whose measurements that fall in each cell.
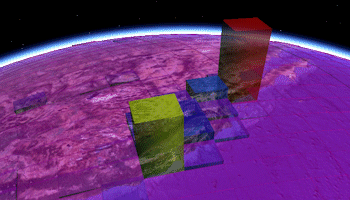
Cumulative: The cell map represents the sum of Z values in each cell.
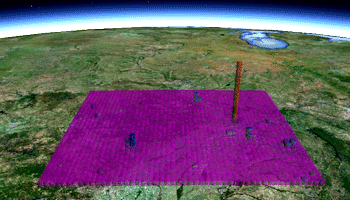
Distance: Represents the distance from the cell node to the closest sample point.
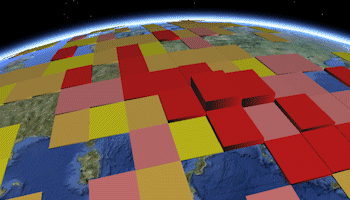
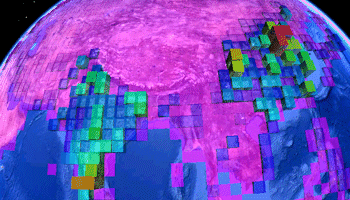
Frequency: The cell map displays the number of samples which occur within each cell.
Maximum: The map illustrates the maximum Z value for samples which are located in each cell.
Minimum: The map represents the mimimum Z value for samples which fall in each cell.
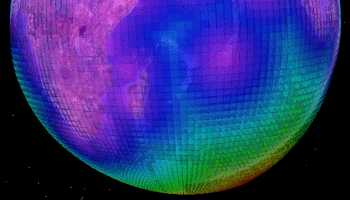
Weighted: The map represents interpolated Z values, using a weighted-average gridding method based on neighboring points.
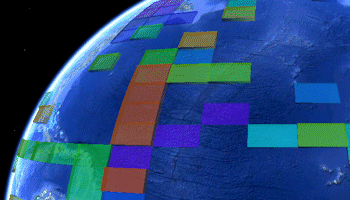
Advanced: All cell map options are available in a single menu.
![]() Back to EarthApps Summary
Back to EarthApps Summary
"Google" is a trademark of Google Inc.
![]()