Tutorial: Illustrate Multiple Components in a Pie Chart Map

Estimated time: 2 minutes.

A Pie Chart Map is a type of symbol map in which each map location is marked with a small pie chart representing a user-selected number of components for that location. We will display the sand-gravel-clay components by site.

! You need to have completed the previous lesson before continuing.

  1. With the "Maps_Soil_Properties.RwDat" data still displayed in the main datasheet, select the Utilities | Maps | Piecharts option.
  2. XY Columns: Use these prompts to tell RockWorks which column contains which data. To change a column name for any of the prompts simply click on the small down-arrow and select another column name. The prompts and column names you need to establish are listed here:
    1. Easting (X): Set to the column Easting.
    2. Northing (Y): Set to the column Northing.
  3. Components
    1. Plot Component #1: Checked. This tells RockWorks to include the data for "component 1" in the pie symbols.
      • Data Column: Set this to the Sand column.
      • Color: Choose a color for this data.
      • Explode: unchecked.
    2. Plot Component #2: Checked. This tells the program to include the data for "component 2" in the pie symbols.
      • Data Column: Set this to the Gravel column.
      • Color: Choose a color for this data.
      • Explode: unchecked.
    3. Plot Component #3: Check this, so that the program will include another component in the symbols.
      • Data Column: Set this to the Clay column.
      • Color: Choose a color for this data.
      • Explode: unchecked.
    4. Plot Component 4Plot Component 9: Be sure these are all un-checked.
  4. Diagram Options: Click this tab to set up the pie charts.
    1. Dimensions: Choose Fixed.
      1. Size: Set this to 2.
      2. Inner Radius: Set this to 0.0.
    2. Labels : Insert a check here to include labels with the pie symbols. Set the Orientation to Horizontal.
  5. Automatic Offset: Uncheck this. In your own work this can be a very handy way to prevent overplotting.
  6. Other map layers: Be sure they are all unchecked.
  7. Click Continue to create the map.

    The program will read the records in the data set and create for each record a small pie chart illustrating the relative Sand-Gravel-Clay components. The mini-pie-charts will be placed at their sample's X,Y coordinates in the map.

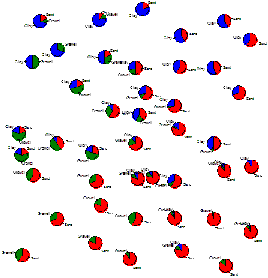
    Note how the sandy soils in the southeast grade into clayey soils in the north and west.

    If you are interested in adding border annotation to this map, save the map as instructed below, and then jump to the RockPlot2D tutorial.

  8. Save this map by choosing File | Save from the RockPlot menu, entering the file name:  Piechart Map    and clicking Save.
  9. Close this window (X).

  Pie Chart Maps


  Back to component menu


RockWare home page