![]() Estimated time: 3 minutes.
Estimated time: 3 minutes.
In this lesson, you will look at how downhole P-Data is entered, how the columns are defined, how to edit the data as a datasheet, and how to query the data based on p-data value ranges.

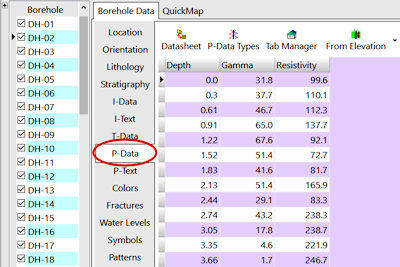
! Note how each row contains a single depth, and multiple columns of measurements. These values can represent gamma, resistivity, other elog data, drilling rate, or any point-sampled downhole data. (What RockWorks calls "interval" or I-Data – in an earlier lesson set – is entered with a top and bottom depth, and measurement(s) for the interval.) If a component has no measurement for a particular depth, it can be left blank, since in your own work different tracks may have different sampling intervals.
There's no limit to the number of components for which you can enter measurements. Let's take a look.
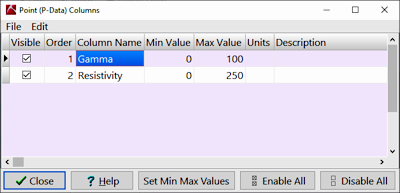
The component name appears here as it will be listed as a column heading in the P-Data Table. The Order value determines the column order in the Borehole Manager display, and the Visible checkbox defines whether the column is visible or not. Optionally you can define the min and max values for each parameter and enter comments regarding units and descriptive notes.
In your own work you can add components to the P-Data table (and columns to the Borehole Manager display) by clicking in the last shown row, pressing the down-arrow key, and defining these fields for the new measurement type.
![]()