![]() Estimated time: 4 minutes.
Estimated time: 4 minutes.
In this lesson, you will get a quick view of one P-Data component (Gamma) as entered for the project’s boreholes, by generating 3D logs.
This window has several sections:
The left side offers the Main Options, where general diagram settings are established.
The 3D Log Design tab at the top of the window is where you establish the log-specific settings.
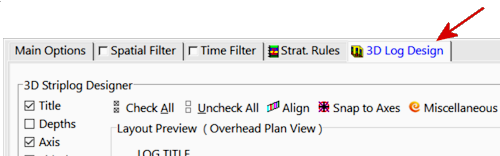
Choose the items you want to see in the logs by inserting a check-mark in the following items in the list along the left:
! You can drag the splitter between the Preview and the Options panes to create space, if necessary.
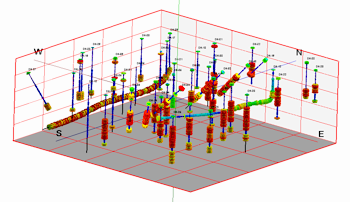
The program will create a log for each enabled borehole, including well name at the top, and color-coded Gamma-value discs displayed down the log. They will be displayed in a new, RockPlot3D tab, to the right.
The 3D scene is displayed in the pane to the right, and the image components as well as the standard reference items are listed in the pane just to the left of the image. The expandable/collapsible list on the left is called the "data tree."
![]()