 Estimated time: 3 minutes.
In this lesson, you will load a dataset that has X and Y location coordinates and a variety of measured values. You will create a map in which cone symbols are placed at the map locations, scaled in size and color based on the magnitude of one of the components in the listing. This is a quick way to quickly visualize the spatial and measured values in your data.
- Return to the RockWorks program window (you can leave Google Earth open if you just completed the Icon Map lesson).
- Return to the Project Manager program tab, and, under the Datasheet Files heading, look for the "Earth_Cones_Proportional_Sediment.RwDat" sample file. Double-click on this file name to open it into the datasheet.
This file contains stream sediment data. We'll use this to display samples as scaled cones within Google Earth.
- Click on the Earth menu (Utilities grouping), and select the Cones menu option.
- Data Columns: In these prompts, be sure the following columns are selected. This tells RockWorks which columns contain which data. (If the wrong column title is displayed, just click on the down-arrow and scroll up or down to the correct column title.)
- X (Easting): Longitude
- Y (Northing): Latitude
- Cone Direction: Choose Downward Pointing Cones.
- Cone Radius: Click on this tab to establish the radius of the cones in meters.
 Proportional (Scaled Relative to Column Data): Click in this radio button.
- Data Column: Choose the AU_PPM column here. This will scale the cone radii based on the gold concentrations.
- Minimum Radius: Click to the right and type in: 100
- Maximum Radius: Click to the right and type in: 1000
This tells RockWorks to plot the cones where the smallest values were measured with a radius of 100 meters and those where the highest values were measured a radius of 1000 meters. The cones will be scaled automatically between these radii for intermediate values.
- Cone Height: Click on this tab to establish the height of the cones in meters.
- Proportional (Scaled Relative to Column Data): Click in this radio button.
- Data Column: Choose the AU_PPM column here. This will scale the cone height based on the gold concentrations.
- Minimum Height: Click to the right and type in: 100
- Maximum Height: Click to the right and type in: 2000
This tells RockWorks to plot the cones where the smallest values were measured with a height of 190 meters and those where the highest values were measured a radius of 2000 meters. As above, the height of the cones where intermediate values are listed will be scaled automatically.
- Cone Color:
- Proportional (Based on Z Column): Click in this radio button. This tells Rockworks to plot low-value cones in cool colors, high-value cones in hot colors, and intermediate cones colored gradationally in between.
- Data Column: Again, choose the AU_PPM column to vary the color based on gold concentrations.
 Cone Labels: Uncheck this option.
- Click the Continue button at the bottom of the window.
RockWorks will create a KML file listing the cones at the point locations. It will create a KMZ (zip) file containing the KML file. The Google Earth KML and KMZ file names will be assigned automatically. Be patient - it will take a moment to generate the map for the 500 samples in this datasheet.
The resulting map will be displayed in Google Earth, if requested. The "Cones" layer will be listed under Temporary Places on the left side of the Google Earth display.
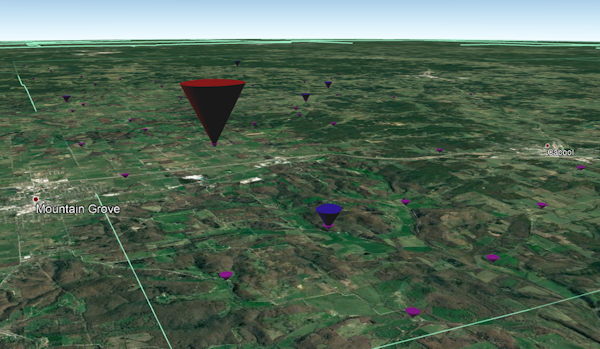
- Use your navigation tools in Google Earth to zoom in to the map area; you can also just double-click in the center of the display to zoom in. You can use your mouse to rotate the image to the left, right, up, and downward. Notice how the sites with the small values are shown with small cones, and those with high gold values are shown with large cones.
- If you would like to save this map, right-click on it and choose Save to My Places.
- You can leave the Google Earth window open if you'll be doing the next lesson.
 Earth Maps

RockWare home page