The color point-mapping tool in the RockWorks Utilities (3D | Points) offers variable scaling of the 3D symbols. This means that the size of the spheres/cubes can vary across the diagram, based on the quantitative value measured at each sample site. With this scheme, you can declare actual symbol sizes for as many z-value ranges as you wish, using a "Color Point Map Range Table."
! You can store multiple Color Point Map Range tables in your project database. If you assign detailed names they'll be easy to distinguish when you're selecting which to use. Color Point Map Range tables can be accessed in the Project Manger, under the Project Tables | Map/Model Tables grouping.
These tables have a very simple format, containing 5 columns of information.
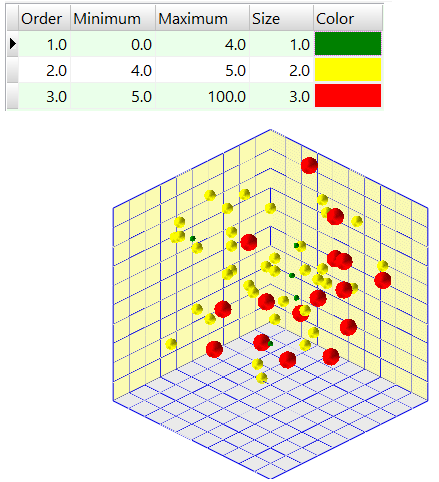
- Order: The values are assigned automatically as you edit the table. You can edit the Order values to re-order the rows.
- Minimum and Maximum: These represent any real numbes, and are used to establish a measured value range. Any sample points in the main data sheet containing z-values (in a column specified by the user), that fall within this declared range will be plotted on the diagram at the color and size declared to the right.
- Size: In this column, for each z-value range, enter the size at which the 3D sphere or cube symbol will be plotted in the 3D map. The size is declared in percent of your project's size.
In the above example, any samples in the data sheet with user-specified Z-values ranging from 4 to 5 would be represented in the 3D map with yellow symbols at 2 percent of the project extents. Samples in the data sheet with Z-values ranging from 5 to 100 would be plotted with red symbols at 3 percent of the project extents.
- Color: Choose a color for the sphere for the declared z-value range by double-clicking in the Color column and making a selection.

RockWare home page