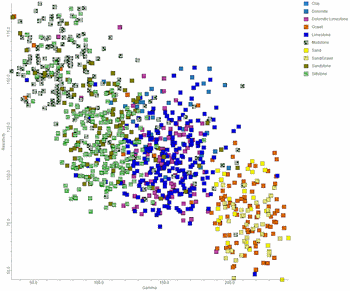
Here's a detailed example of how you might apply this tool. Let's say that we have gamma, resistivity, and lithology for five "calibration wells". The program will create a scattergram (aka "crossplot") plotting gamma versus resistivity.

The symbols within the scattergram represent the lithology that is found for each combination of gamma and resistivity.
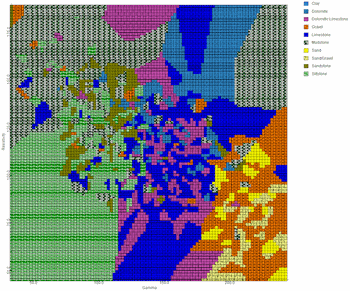
Next, the program interpolates a grid model in which the x-coordinate represents gamma, the y-coordinate represents resistivity, and the grid node values represent the lithology. The grid node values are estimated by comparing the relative number of occurrences (frequency) and interpolating values for undefined nodes based on a "closest-point" algorithm.

This grid will be used by the "Apply Predictive Model" program as a "lookup table" for predicting the lithology for logs that do not include lithology.
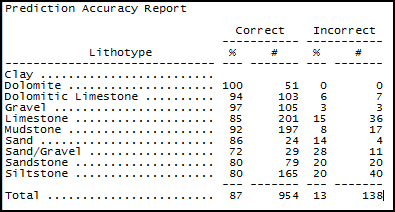
Once the predictive model has been generated, the program will compare the initial calibration data with the predictive model in order to generate an "Accuracy Report" as shown by the following example. This method of testing the validity of the predictive model is called "jackknifing".

! This report is extremely important because it provides a measure of how well the p-data combination (e.g. gamma and resistivity) can be used to predict lithology. For example, consider the example report shown above in which a predictive model was created based on gamma, resistivity, and the listed lithologies. The clay data is blank because the calibration boreholes did not contain any clay. In other words, the model cannot be used to predict clay based on gamma/resistivity data. Now, consider the "Dolomitic Limestone". There were 110 gamma/resistivity points within the Dolomitic Limestone. The predictive model correctly identified Dolomitic Limestone for 94% of the gamma/resistivity samples. On the other hand, consider the Sand/Gravel data: The program incorrectly identified 28% of the gamma/resistivity points within the Sand/Gravel as something else.
By now, it should be clear that this program only works for data sets in which the p-data combination correlates with the lithotypes. The Prediction Accuracy Report will tell you if this is the case. If the results of the Prediction Accuracy Report are unsatisfactory, you should not proceed to the Apply Predictive Model step.
![]() Return to Create Predictive Model
Return to Create Predictive Model