This program reads a column of P-Data that represents grade values (e.g. eUranium) and computes a variety of GT (grade x thickness) statistical information based on user-defined minimum grade and maximum waste-thickness cutoff values.
The output from this program may be stored in a variety of output formats, including the RockWorks datasheet for subsequent point-mapping and/or contouring.
Feature Level: RockWorks Standard and higher
Menu Options
Step-by-Step Summary
! Any existing data will be overwritten.
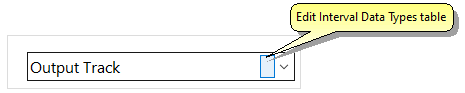
! If you need to add a new track to the I-Data table, click the rectangular button to access the I-Data Types Table.
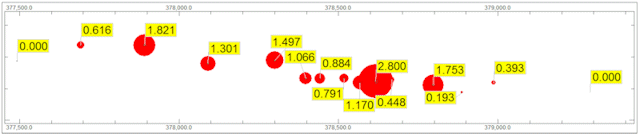
This data is intended for plotting borehole location maps in which the point label represents a summary to the borehole's economic value. These values may also be contoured, but (and this is important), inclined boreholes will produce misleading contour maps since the xy location for each point always corresponds with collar location. Please note that creating an XYZ file only makes sense if you're processing all of the boreholes (see "Apply to" option above).
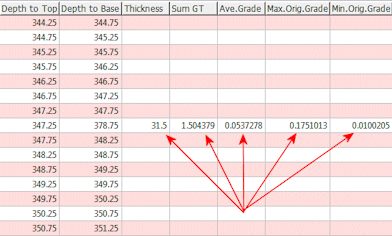
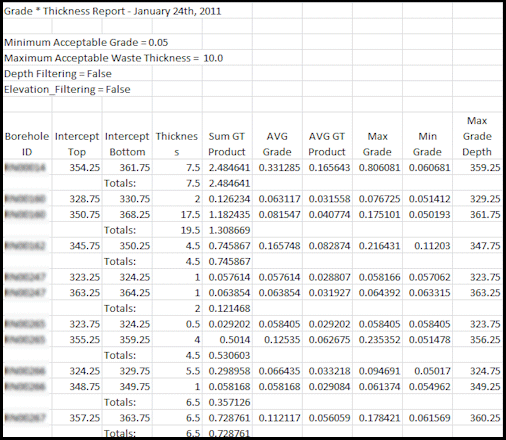
RockWorks will read the contents of the input P-Data track, determine for each borehole the areas where the minimum grade and maximum waste parameters are met, and determine the thickness of those zones or intercepts.
The program will record the computations in the requested output report format(s).
![]() Back to P-Data Menu Summary
Back to P-Data Menu Summary
![]()