RockWorks | Graphics | Images | Digitize
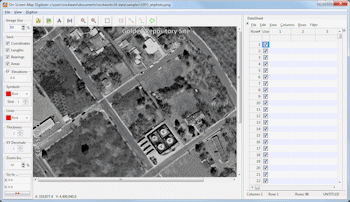
This program is used to import a bitmap image (BMP, JPEG, TIFF, WMF, EMF, PNG, GIF, TGA, and PCX format), calibrate it to global coordinates, and digitize points, lines, polylines, or polygons. As the items are selected, the global coordinates are stored within an editable data window along the right side of the screen. This data may then be copied into other applications.
Possible applications include:
- Digitizing xy coordinates for various features (e.g. well-locations, sample sites, etc.) for subsequent mapping within other programs (e.g. RockWorks point-mapping utilities).
- Digitizing linear features (e.g. fractures) for processing by RockWorks lineation analysis software (lineation gridding, rose diagrams).
- Digitizing polygons for lease boundaries.
- Digitizing points along a contour map (changing the elevation accordingly) and then gridding the data within RockWorks.
Feature Level: RockWorks Basic and higher
Menu Options
Step-by-Step Summary
- Raster (Bitmap) Image: Click here to browse for the input image.
- Calibration Method: The calibration options determine how the program will convert bitmap pixels (picture elements) to global map coordinates. Choose one of the methods:
- Manually Define Min/Max: Choose this option to type in the coordinates that represent the opposite corners of the image. This method assumes that the image is oriented exactly east/west & north/south.
- X-Minimum: Type in the X (Easting) coordinate to be represented along the west (left) edge of the image.
- X-Maximum: Type in the X (Easting) coordinate to be represented along the east (right) edge of the image.
- Y-Minimum: Enter the Y (Northing) coordinate to be represented along the south (lower) edge of the image.
- Y-Maximum: Enter the Y (Northing) coordinate to be represented along the north (upper) edge of the image.
- Min/Max Defined within Text File: Choose this option if you have the minimum and maximum coordinates listed in an external text file. Browse for the name of this file. The format for the file calibration is just a list of coordinates, one on each line:
X Min
Y Min
X Max
Y Max
The numbers must be listed using a US number format.
- 3-Point Calibration: Choose this option if you will enter three known coordinates and then interactively click on these points in the map. This method will allow for some tilt relative to a perfectly east/west & north/south aligned image. When you are done entering the X and Y coordinates for the three points, the program will prompt you to click on the image where those three calibration points reside.
- Point 1: Type in the X and Y coordinates for the first known point on the image.
- Point 2: Type in the X and Y coordinates for the second known point on the image.
- Point 3: Enter the X and Y coordinates for the third known point on the image.
- The Digitizing Window
- Left menu bar: These settings along the left edge of the digitizer window establish various bitmap-digitizer options.
- Image Size: This will display the current zoom state of the image. Choose a different zoom percent to zoom in or out. You can also use the Enlarge and Reduce tools at the top of the digitize window.
- Save: Insert a check in the items to be recorded as you digitize your points, lines, polylines, and polygons.
- Coordinates: Check this for the XY coordinates to be recorded for the points, endpoints, or vertices that you digitize.
- Lengths: Check this for line or polyline length to be calculated and included in the output data.
- Bearings: Check this for line bearings to be computed and included in the output data.
- Area: Check this for polygon area to be computed and included in the ouput data.
- Elevations: Check this to include elevations with the digitized coordinates. Enter the elevation value into the prompt.
- Symbols: Symbols will be placed on the bitmap image as you digitize points, lines, polylines, and polygons.
- Color: Click here to select the color for the symbols.
- Size: Click here to establish the symbol size, declared as a percent of the diagram width. Default = 3.
- Lines: Lines will be placed on the bitmap image as you digitize lines, polylines, and polygons.
- Color: Click here to select the color for the lines.
- Thickness: Choose a line thickness from 1 to 10, with 1 being thin and 10 being very thick.
- X,Y Decimals: Establish the number of decimal places to be used when recording the X and Y coordinates.
- Zoom Inc: Click to enter the scaling increments for each click on the Size settings box, in the main window. For example, a setting of "10" will offer 70%, 80%, 90%, 100%, 110% (etc.) zoom increments.
- Scroll Inc: Use this setting to define the number of pixels to be moved with each click of the side and lower scroll bar.
- Go to...: Use these prompts to adjust the current image view to the specific coordinates you enter here. Click the small arrow button to enact the move.
- Upper menu bar
- Calibrate: Click here to return to the previous screen to define the calibration method.
- Enlarge: Zooms into the image display. Use the scroll bars along the bottom and right side to adjust the view. You can adjust the Zoom In (and Zoom Out) increment using the "Zoom Inc" setting along the left side of the window.
- Reduce: Zooms out of the image display.
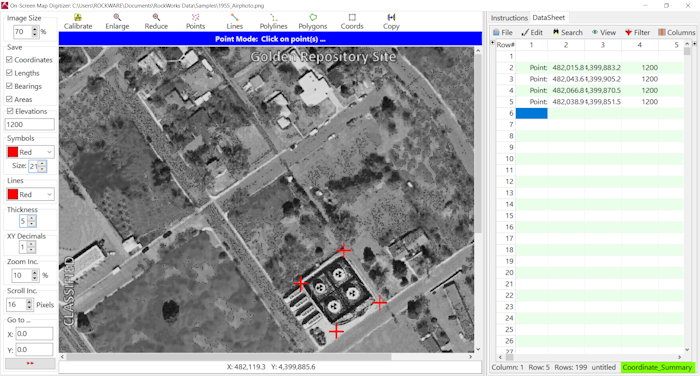
- Point: This tool records the X and Y coordinate for each point you click. It will also post the value listed to the left, under Elevation, as the Z value for each point. Symbols will be plotted in the map window for each point you click, using the color and size settings in the menu to the left.
- Lines: This tool allows you to point-and-click the beginning and ending points of single line segments. The specific measurements (point coordinates, elevations, bearings, lengths) can be posted in the data window. Be sure to activate the specific data to be recorded using the check boxes to the left. Lines will be plotted in the map window using the color and thickness settings in the menu to the left.
- Polylines: This tool allows you to point-and-click the points at each vertex of a multi-segmented line, such as a log curve or open contour line. Its specific measurements (vertex coordinates and total length) can be posted in the data window. Activate the specific measurements to be recorded using the checkboxes to the left. To terminate the polyline, double-click the last point. Polylines will be plotted in the map window as you digitize, using the color and thickness settings in the menu to the left.
- Polygons: This tool allows you to point-and-click the points along the perimeter of a polygonal area. Its specific measurements (vertex coordinates, area, or perimeter) can be posted in the data window. Activate the specific measurements to be recorded using the check boxes to the left. To close the polygon, double-click the mouse.
- Coords: Displays the global corner-point coordinates for the bitmap (assuming that the bitmap has been calibrated).
- Data Window: Once you start digitizing, you'll see the data listed in this datasheet, to the right of the image. The data will include the requested Save items (above), using the requested number of decimal places.
- Be sure the image to be digitized resides in the current project folder.
- Select the Graphics | Images| Digitize menu option.
- Browse for the input file and define the calibration method, as described above.
- Click the Continue button to proceed.
- If you have selected the 3-Point calibration method, you will be prompted at the top of the screen to digitize the three points, in sequence, on the image screen. Be sure to use the Enlarge and Reduce buttons to adjust the display as necessary to access the map locations.
- Use the Options settings along the left side of the map window to establish various digitizing parameters.
- Once you are ready to digitize lines, points, polygons, or polylines, choose the desired operation from the upper menu bar, as discussed above.
- Use the Data Window's Edit menu tools to copy the data window's listings to the clipboard, or use the File | Save option to save the entire contents of the data window as an RwDat file.
 Back to Image Menu Summary

RockWare home page