These are the column type definitions available in the RockWorks datasheet. Right-click on any column heading to access these settings, in the Datasheet Setup pane to the right.
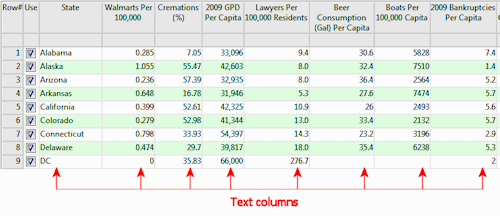
Text Columns: Many of your columns will probably be set to Text, including sample ID's and miscellaneous - unitless - data. Text columns simply display their contents as letters and numbers. Don't set a column to Text if it contains geographic coordinates for mapping.
Date Columns: These columns store dates. You can either type in the data, or double-click to select the date from a calendar. Note that many programs which use dates can also read the date information if formatted as simple text.
X or Y Coordinate Columns: Use this designation for X,Y location coordinates. RockWorks requires that map coordinates be defined with some kind of coordinate information.
Once you've selected the Coordinate System for the XY data and closed the Column Parameters window, you'll need to define the additional coordinate information in the metadata pane to the right of the datasheet.
Linear (Z) Dimensions Columns: Use this designation for data that represent elevations, depths, distances, or other linear measurements. This type of data requires definition of:
Meridian Columns: If you are working with U.S. Public Land Survey (PLS) data - Range, Township, Section, and locations - and wish to spot wells or lease boundaries, or create maps, you must define the Principal Meridian for the land grid survey.
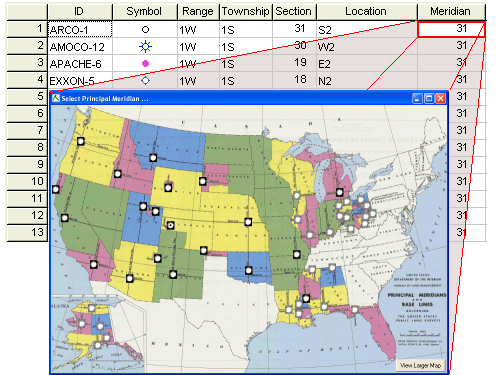
By setting the datasheet column to a Meridian type, double-clicking in a cell will bring up an interactive map for selecting the meridian. Click on the appropriate item and you'll be returned to the datasheet.
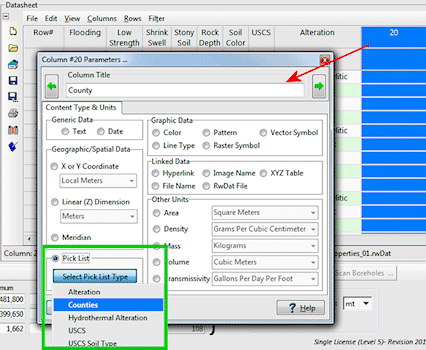
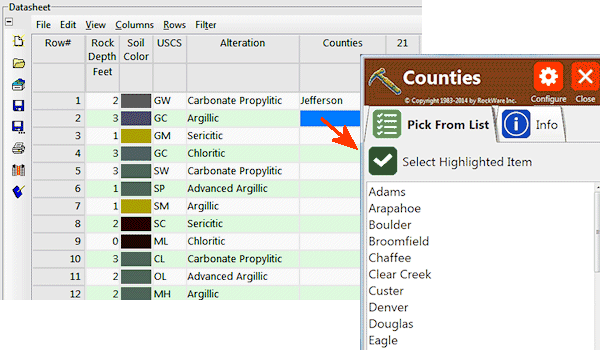
Pick List Columns: Pick List columns link to pre-configured lists of items, such as soil types or descriptive characteristics, which allow for quick selection, especially on a tablet device.
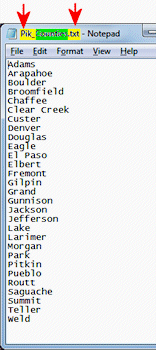
There are a few Pick Lists installed with the program. Or, you can create your own: just create a text file with the list contents, one item on each row, and save the file with a file name that starts with "Pik_" and with a ".txt" file name extension. The Pick List files must reside in the "Tables" folder inside the RockWorks installation folder. If you don't have permission to save files in this location, save the Pik_*.txt" file in another location and copy it to the Program Files folder.
Here's an example:
(1) You create a text file names "Pik_Counties.txt" and you save that file into the \Tables folder described above.
(2) You create a new datasheet in the Utilities and set the column type to Pick List. You'll see your Counties list in the Pick List dropdown - choose that.
(3) Now, when you double-click on a cell in the Counties column, you'll see the Pick List window with the County names.
If you want to add additional reference information, create an HTML file within the same Tables folder with the same name as the text file but with a ".html" extension. For example, if the text file is named "Pik_RockTypes.txt", then name the HTML file "Pik_RockTypes.html". If RockWorks finds an HTML file for the current pick list, it will be shown within an additional tab titled "Info" shown in the example above.
Color Columns: Color columns define colors to be used to represent the record in your Google Earth maps, in your 3D graphic displays (storage tanks, discs, etc.).
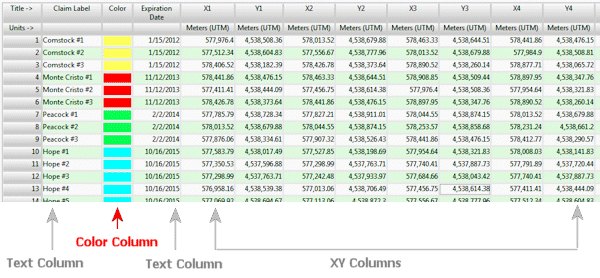
To select a color, double-click in a cell within a Color Column; you'll be presented with a color-selection window. You can choose any available color.
! In the rwDat file, RockWorks actually stores the Windows color number for the selected color.
Line Columns: Datasheet columns that you set as Line columns are used to select and line style and thickness for each sample listed in rows in the main datasheet. The actual line styles and colors are displayed in the column. These are typically used when plotting lineation or arrow maps in the Linears menu.
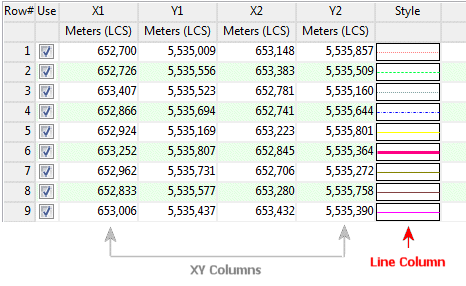
To select a line style and color, simply double-click in the appropriate cell in the datasheet's Line column, and select a line style and width from the displayed list.
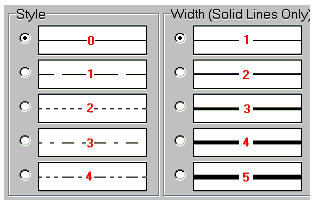
The line styles are actually stored in the rwDat file as textual entries of the selected lines' "style" and "thickness" index numbers as shown in the graphic below. If you were to look at the rwDat file in a text editor, you would see that a solid, thin line is recorded with a "0/1" and a solid, thick line is recorded with a "0/4". A dashed line is recorded as a "1/1" (variable widths are available for solid lines only).
Pattern Columns: Datasheet columns that you set as Pattern columns are used to display actual pattern designs and colors that you have selected for each sample or row in the datasheet. These are often used in lease boundary files to declare a particular pattern with which to fill the lease area in a map.
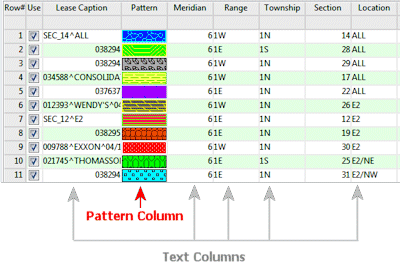
To select a pattern simply double-click in the appropriate cell in the datasheet's Pattern column, and select a pattern and colors from the displayed list.
The patterns are actually stored in the rwDat file as textual entries of the selected patterns' index numbers. If you were to look at the rwDat file in a text editor, you would see that pattern number 1 is recorded with a "1", and pattern number 20 is recorded with a "20".
Patterns are also stored with their "density" as well as the user-selected foreground and background colors, and line width. In Text view, the pattern density, color of the pattern lines (foreground), the color of the background, and line thickness will be listed after the pattern index number. (example: 54/1.0/16711680/16776960/1)
Raster Symbol Columns: Datasheet columns that you set as Raster Symbol columns are used to display bitmap symbol designs, which can be used to display map or sample locations in maps and diagrams, and in Google Earth.
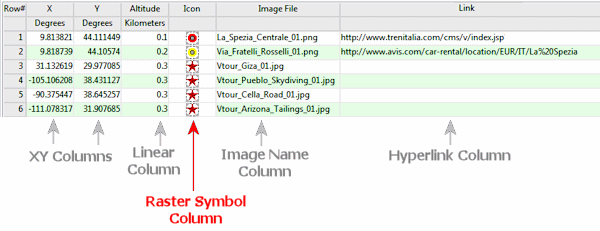
To select a raster symbol for a sample, simply double-click in the appropriate cell in the datasheet's Raster Symbol column and select a symbol from the displayed list. The symbols are stored in the rwDat file with their design numbers (raster symbol 5, for example, is stored simply with the number "5"), but the actual picture can be displayed in the datasheet if the column type is set to Raster Symbol.
RockWorks is installed with a preconfigured list of raster symbol designs.
Symbol Columns: Datasheet columns that you set as Symbol columns are used to display vector symbol designs and colors that you have selected for each well or sample site.
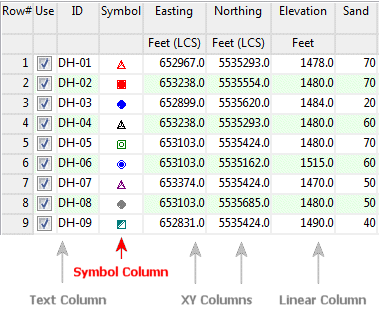
To select a symbol simply double-click in the appropriate cell in the datasheet's Symbol column and select a symbol from the displayed list. The symbols are actually stored in the rwDat file as textual entries of the selected symbols' index numbers. Looking at the rwDat file in a text editor you would see that symbol number 5 is recorded with a "5", and symbol number 17 is recorded with a "17", and so on.
Symbols are stored with a user-selected color, such as: 3/33023 for symbol #3 in red.
File Name Columns: These are used to list file names. This can be a handy way to select file names for graphic image lists, grid lists, etc. Note that you can list file names simply as text if you prefer.
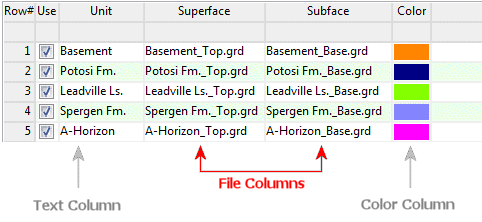
When you click in a File cell, the program will display a browse window where you can select the name of the file to be listed in the cell.
Hyperlink Columns: These are used to list URL addresses. These are typically used in Google Earth placemark files - the URL hyperlinks can be uploaded into the KMZ file for display in Google Earth.
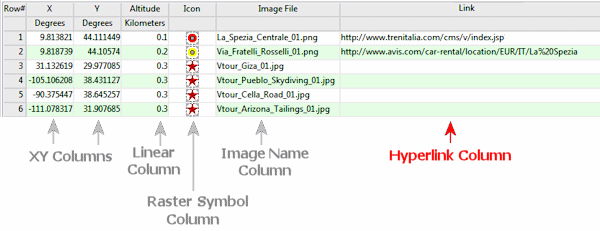
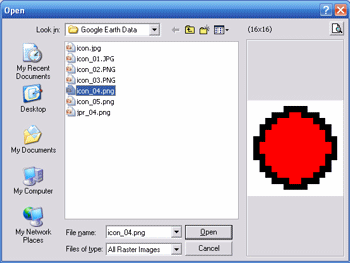
Image Name Columns: These are used to list file names. This can be a handy way to select file names for graphic image lists, etc. This is very similar to the "File" data type except that the dialog previews the image.
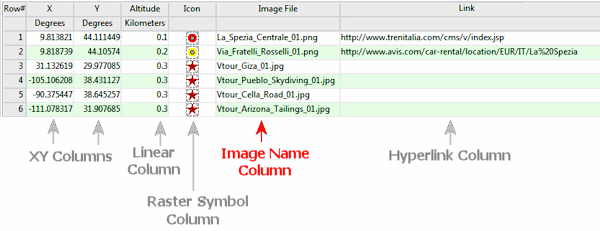
If a column data-type has been set to an "Image Name" type, the program will automatically display a file-selection dialog, with an image-preview screen, whenever the user double-clicks on a cell within that data column.
XYZ Table Columns: Choose this column type if you need to link an external text file, containing XYZ points, files to the current file.
RwDat File Columns: Choose this column type if you need to link other RwDat files to the current file.
Area Columns: Choose this column type if the contents represent area computations. This type of data requires definition of:
Density Columns: Choose this column type if the contents represent density computations. This type of data requires definition of:
Mass Columns: Choose this column type if the contents represent mass computations. This type of data requires definition of:
Volume Columns: Choose this column type if the contents represent volume computations. This type of data requires definition of:
Transmissivity Columns: Choose this column type if the contents represent transmissivity values for hydrology drawdown calculations. This type of data requires definition of:
![]()